. 2012;7(4):e32294.
doi: 10.1371/journal.pone.0032294. Epub 2012 Apr 4.

Regulation of mat responses by a differentiation MAPK pathway in Saccharomyces cerevisiae

Affiliations

Regulation of mat responses by a differentiation MAPK pathway in Saccharomyces cerevisiae

Sheelarani Karunanithi et al. PLoS One. 2012.

Abstract

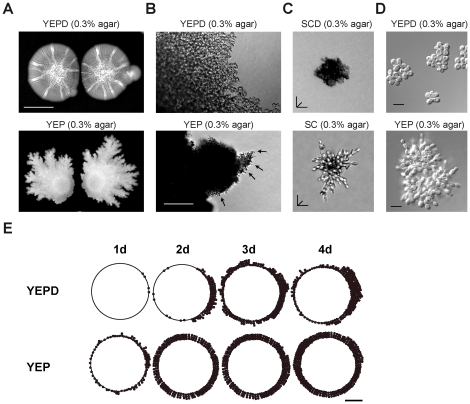
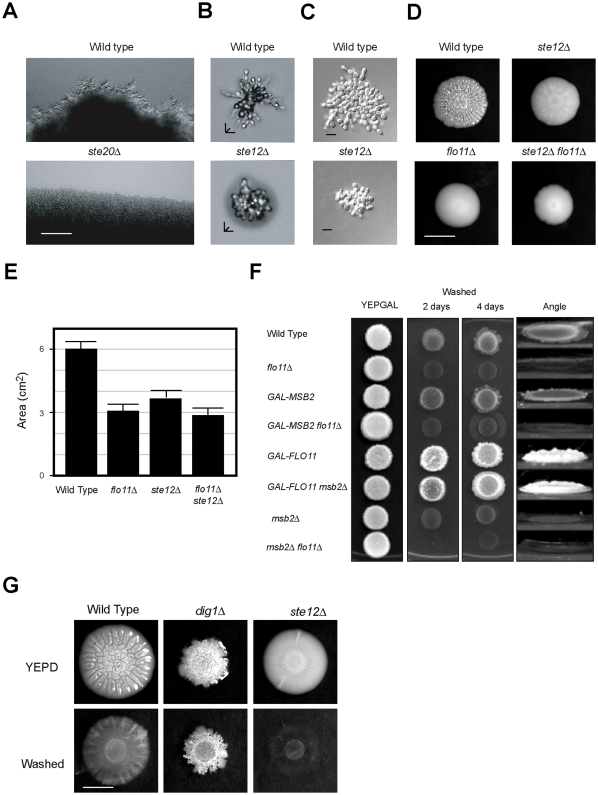
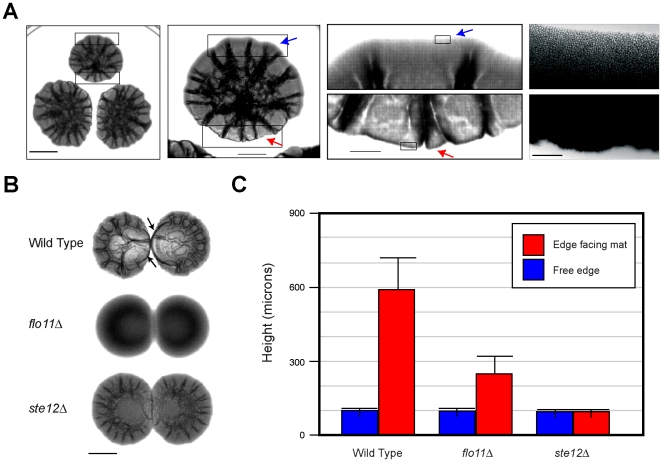
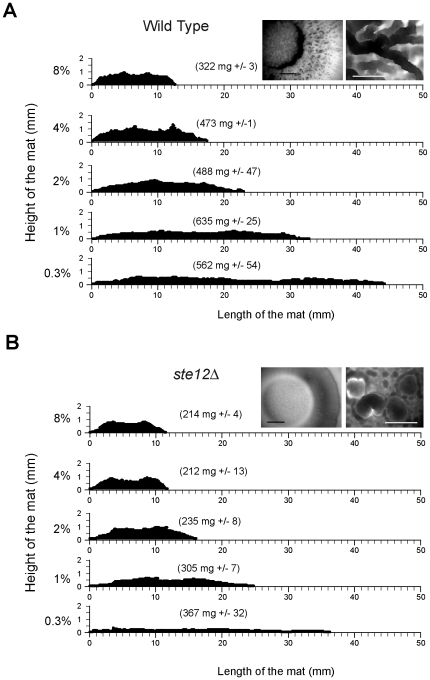
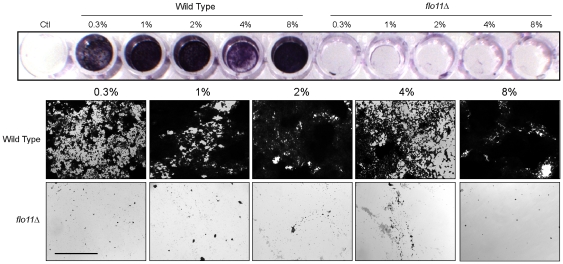
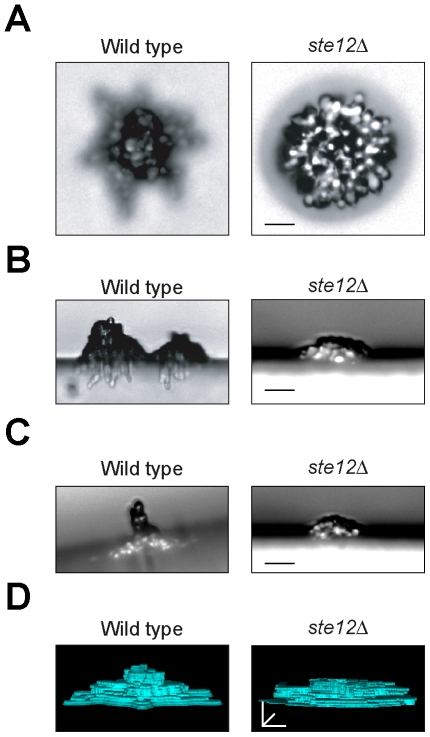
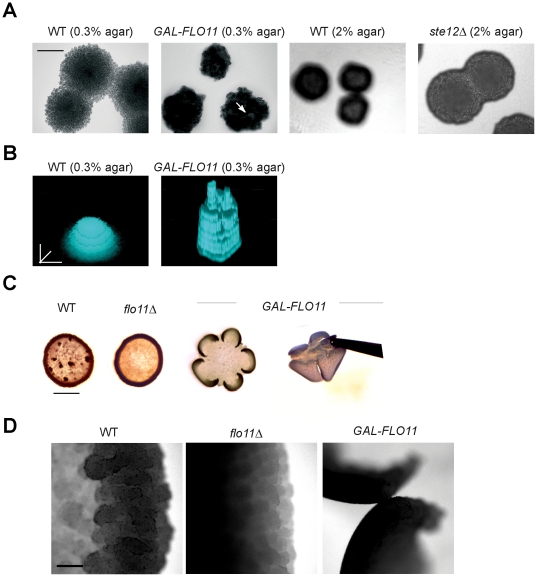
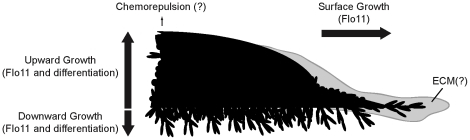
Fungal species exhibit diverse behaviors when presented with extracellular challenges. Pathogenic fungi can undergo cell differentiation and biofilm formation in response to fluctuating nutrient levels, and these responses are required for virulence. In the model fungal eukaryote Saccharomyces cerevisiae, nutrient limitation induces filamentous growth and biofilm/mat formation. Both responses require the same signal transduction (MAPK) pathway and the same cell adhesion molecule (Flo11) but have been studied under different conditions. We found that filamentous growth and mat formation are aspects of a related response that is regulated by the MAPK pathway. Cells in yeast-form mats differentiated into pseudohyphae in response to nutrient limitation. The MAPK pathway regulated mat expansion (in the plane of the XY-axis) and substrate invasion (downward in the plane of the Z-axis), which optimized the mat's response to extracellular nutrient levels. The MAPK pathway also regulated an upward growth pattern (in the plane of the Z-axis) in response to nutrient limitation and changes in surface rigidity. Upward growth allowed for another level of mat responsiveness and resembled a type of colonial chemorepulsion. Together our results show that signaling pathways play critical roles in regulating social behaviors in which fungal cells participate. Signaling pathways may regulate similar processes in pathogens, whose highly nuanced responses are required for virulence.


Conflict of interest statement

Competing Interests: The authors have declared that no competing interests exist.

Figures

Figure 1
Figure 1. S. cerevisiae forms filamentous mats.
A) Wild-type cells (PC313) were spotted 2 cm apart onto 0.3% agar media that contained (YEPD; top panel) or lacked (YEP; bottom panel) glucose. The YEPD plate was incubated for 4 days and photographed; the YEP plate for 15 days. Bar = 1 cm. B) Microscopic examination of perimeters of mats in 1A. Bar = 100 microns. C) The origin of filamentous mats. Wild type (PC538) cells were examined on synthetic medium either containing 2% glucose (SCD) or lacking glucose (SC) in 0.3% agar medium for 24 h at 30°C. A compiled Z-stack rendering of typical microcolonies are shown. Bar = 20 microns. D) Same strains in 1C were examined on rich medium either containing 2% glucose (YEPD) or lacking glucose (YEP) in 0.3% agar. A representative microscopic image is shown. Bar = 10 microns. E) Vegetative mats mature into filamentous mats over time as nutrients become limiting. Two mats of wild type (PC313) strain were spotted bilaterally (1.5 cm apart) on YEPD and YEP media (+0.2% galactose) containing 0.3% agar media. The number of filaments occurring along the circumference of mats was scored on a scale of 1, 2, or 3 dots at 20× magnification corresponding to 3, 6, or 9 filaments or greater, respectively. Dots were plotted on a circle representing the outline of one of the mats with right hemispheres corresponding to the side of the mat facing a second mat. Asymmetric filamentation observed in the right hemisphere of 2d, Glu can possibly result from nutritional stress compounded by nutrient depletion from adjacent mats. Filamentation was monitored and plotted after growth for 1, 2, 3, and 4 days. Quantitation of pseudohyphae was complicated at longer time points when biofilms began to variegate . Bar = 1 cm.
Figure 2
Figure 2. The filamentous growth pathway regulates foraging responses.
A) Microscopic examination of mat perimeters grown on YEP 0.3% agar medium; top panel, wild-type cells (PC313), bottom panel ste20Δ mutant (PC549). Bar = 50 µM. B) The formation of pseudohyphae in filamentous mats is dependent on the MAPK pathway. Wild type (PC538) and the ste12Δ (PC539) mutant were spotted onto synthetic media (lacking glucose) in 0.3% agar medium for 24 h at 30°C. A compiled Z-stack rendering of typical microcolonies are shown. Bar = 10 microns. C) Same strains in 2B were examined on rich medium lacking glucose (YEP) in 0.3% agar. A representative microscopic image is shown. Bar = 10 microns. D) Genetic analysis of the roles of the MAPK pathway and Flo11 in mat formation. Cells of the indicated genetic backgrounds were spotted onto YEPD media (0.3% agar) for 4 days and a representative mat was photographed. Bar = 1 cm. E) Quantitation of the surface area of the mats in D. Mats were spotted in duplicate; error bars represent the average of two separate trials. F) Plate-washing assay of cells overexpressing MSB2 and FLO11 in various genetic backgrounds. Cells were spotted onto YEPGAL and incubated for 2d and 4d. The plate was photographed, washed, and photographed again. At right, a photograph of the plate taken at a 45° angle. G) Role of hyperactive MAPK pathway in regulating filamentous mats. Wild-type (PC538), ste12Δ (PC2382), dig1Δ (PC3039), were spotted onto YEPD media (0.3% agar) and grown at 30°C. Plates were photographed after 4d, cooled to 4°C for 30 min, washed and photographed again to reveal increase in invasion inhibits mat expansion. Bar = 1 cm.
Figure 3
Figure 3. MAPK- and Flo11-dependent colony avoidance response.
A) Wild-type cells were spotted in three spots and examined daily. The photograph showing the embossed appearance of colonies was taken at day 3. Left three panels, Bar = 1 cm. Far right panel, micrograph of cells at the perimeter of an asymmetrically forming biofilm. Bar, 200 microns. Mat borders facing (red arrows) or not facing (blue arrows) another mat are indicated. B) Wild type (PC538), flo11Δ (PC1029), and ste12Δ (PC2382) cells were grown on YEPD media for 18 h. Equal concentrations of cells were spotted, 1 cm apart, on to YEPD media containing 0.3% agar. Plates were incubated for 48 h at 30°C and photographed using transmitted light. Bar = 1 cm. C) Bar graph of height measurements (in mm) of the mat borders facing/not facing the adjacent mats on the right in B. Contour maps in the Z-axis of mats was generated. Seven readings after the first peak in the Z-axis were averaged to plot the graph. Standard deviation between measurements were used to generate the error bars.
Figure 4
Figure 4. The role of the MAPK pathway in regulating mat architecture when exposed to surfaces of different rigidities.
A) Contour maps in the Z-axis of wild type (PC538) mats incubated in media of different agar concentrations for 14d. Insets show mat morphology (left, photograph, bar, 1 cm; right, photomicrograph, bar, 200 microns) in 4% agar. The numbers in parentheses represent the average mat dry weight from two experiments with standard deviation shown. Scale bars for the X and Y-axes are in mm. B) Mats formed by a ste12Δ mutant (PC539) on different agar concentrations. Analysis is as described for panel A.
Figure 5
Figure 5. Yeast mats grown on a variety of surface rigidities exhibit Flo11-dependent adherence.
Mats of wild type (PC 538) and flo11Δ (PC 1029) mutant were grown for 11 days on YEPD medium containing % agar concentrations as indicated. Adherence of cells in different mats was estimated by adherence to plastic using crystal violet dye. The control well (Ctl) contained water only. Below, photomicrographs of the wells are shown. Top panels, wild type; bottom panels, flo11Δ. Agar concentrations are as indicated. Bar = 10 µm.
Figure 6
Figure 6. Analysis of filamentation in mats grown on high-agar surfaces.
Wild type (PC538) and ste12Δ mutant (PC539) were compared by microscopy at 10× on 4% agar medium. A) Top view of typical microcolonies grown on synthetic medium lacking glucose with 4% agar, Bar, 20 microns. B) Cross-section view of typical microcolonies as those described in panel 6A. Images were obtained by cutting the agar medium and laying agar slabs at a 90° angle. Bar, 20 microns. C) Plates tilted at a 20° angle. Shown are examples of arial pseudohyphae produced by wild type microcolonies (PC538). At right, the ste12Δ (PC539) mutant fails to form extensive arial pseudohyphae. The image shown is a compiled Z-stack rendering of a typical microcolony. Bar = 25 microns. D) 3D rendering of the microcolonies shown in panel A. Movies of the rendered images are found in the supplemental materials (Supplemental Movies S1, S2, S3, and S4).
Figure 7
Figure 7. The role of Flo11 overexpression on upward growth in the plane of the Z-axis.
A) Microcolonies of wild-type cells (PC538) and cells overexpressing FLO11 (PC2712) were examined by microscopy at 10× after 24 h incubation at 30°C. Wild type and ste12 mats on high agar concentrations is also shown Bar = 100 microns. B) Contour mapping of z-stack rendering of the indicated microcolonies in panel 7A are shown. Bar = 30 microns. See Supplemental Movies S5 and S6. C) Wild-type (PC538), flo11Δ (PC1029), and GAL-FLO11 (PC2712) cells were spotted onto YEP-GAL medium (8%) agar atop nitrocellulose filters for 24 h at 30°C. Colonies were photographed in transmitted light. Bar = 1 cm. At right, separation of the GAL-FLO11 mat from the surface using forceps. D) Microscopic examination of the mats in panel C. Bar = 200 microns.
Figure 8
Figure 8. Model for the different mat responses controlled by the MAPK pathway.
Schematic of a mat expanding under nutrient-limiting conditions is shown. Different responses regulated by the MAPK pathway may include: 1) mat expansion in the plane of the XY-axis (surface growth, through Flo11 [23]), 2) cell differentiation that causes invasive growth in the Z-axis (downward growth, Flo11 and differentiation), and 3) upward growth in the plane of the Z-axis in response to surface rigidity and nutrient-limiting conditions (Flo11 and differentiation). This upward growth may represent a type of chemorepulsion. An extracellular matrix (ECM), which may contain shed Flo11 as well as other proteins is depicted.

References

    1. Costerton JW, Lewandowski Z, Caldwell DE, Korber DR, Lappin-Scott HM. Microbial biofilms. Annu Rev Microbiol. 1995;49:711–745. - PubMed
    1. Beauvais A, Loussert C, Prevost MC, Verstrepen K, Latge JP. Characterization of a biofilm-like extracellular matrix in FLO1-expressing Saccharomyces cerevisiae cells. FEMS Yeast Res. 2009;9:411–419. - PubMed
    1. Parsek MR, Greenberg EP. Sociomicrobiology: the connections between quorum sensing and biofilms. Trends Microbiol. 2005;13:27–33. - PubMed
    1. Smukalla S, Caldara M, Pochet N, Beauvais A, Guadagnini S, et al. FLO1 is a variable green beard gene that drives biofilm-like cooperation in budding yeast. Cell. 2008;135:726–737. - PMC - PubMed
    1. Chandra J, Zhou G, Ghannoum MA. Fungal biofilms and antimycotics. Curr Drug Targets. 2005;6:887–894. - PubMed

Publication types

MeSH terms

Substances