Review
. 2012;7(4):e33515.
doi: 10.1371/journal.pone.0033515. Epub 2012 Apr 4.

Comparative composition, diversity and trophic ecology of sediment macrofauna at vents, seeps and organic falls

Affiliations
Review

Comparative composition, diversity and trophic ecology of sediment macrofauna at vents, seeps and organic falls

Angelo F Bernardino et al. PLoS One. 2012.

Abstract

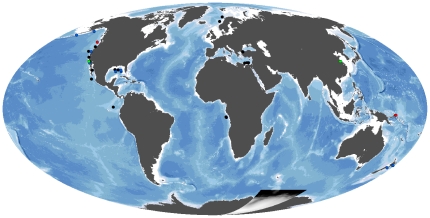
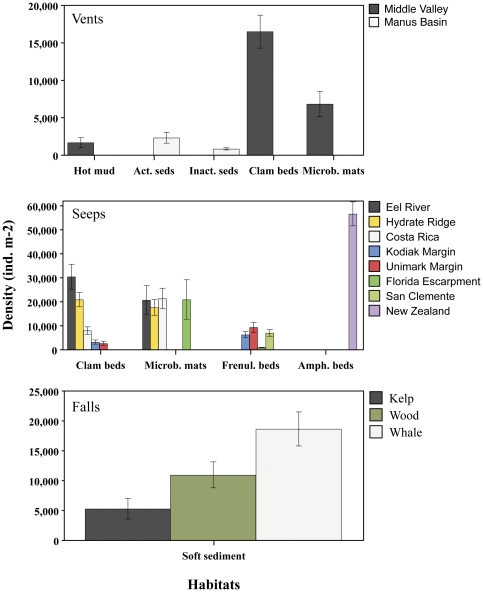
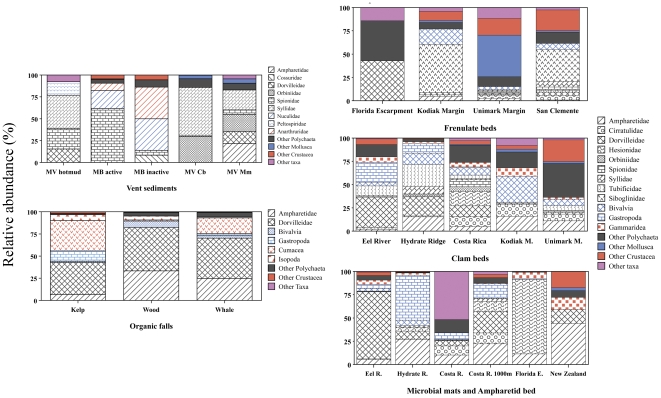
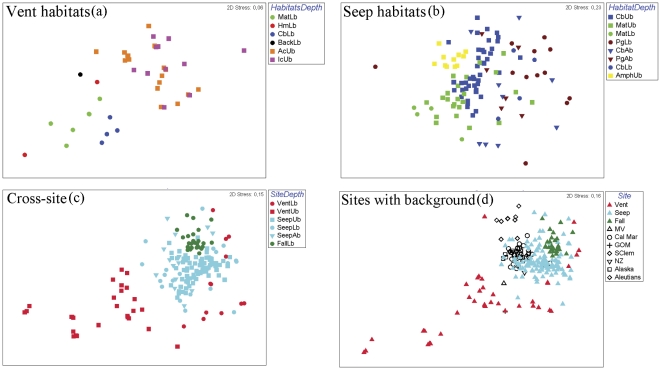
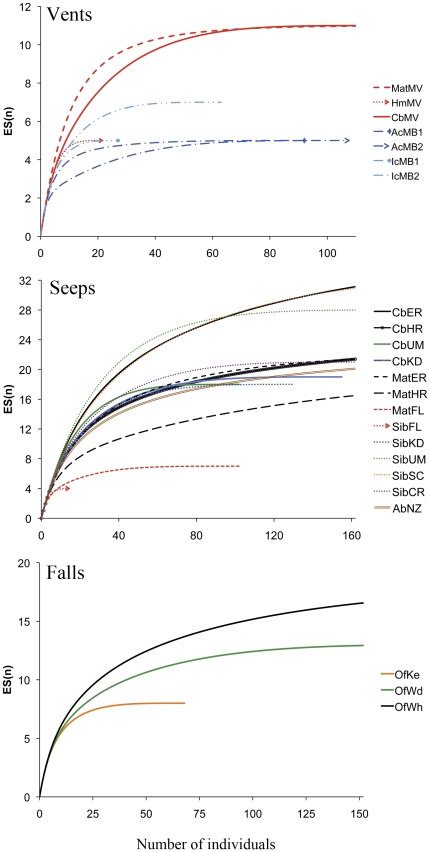
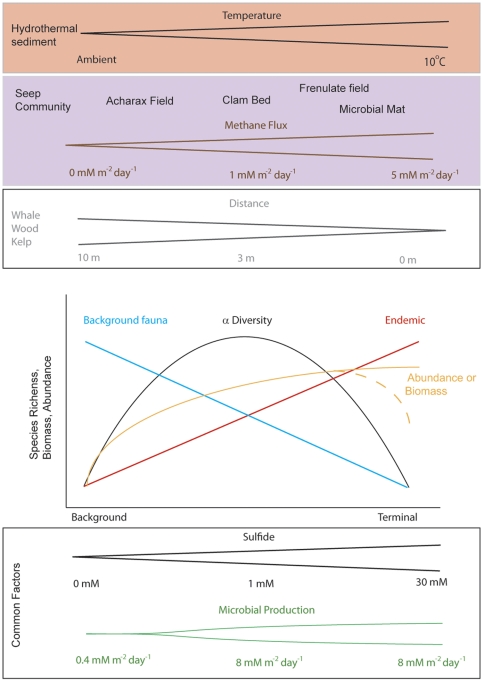
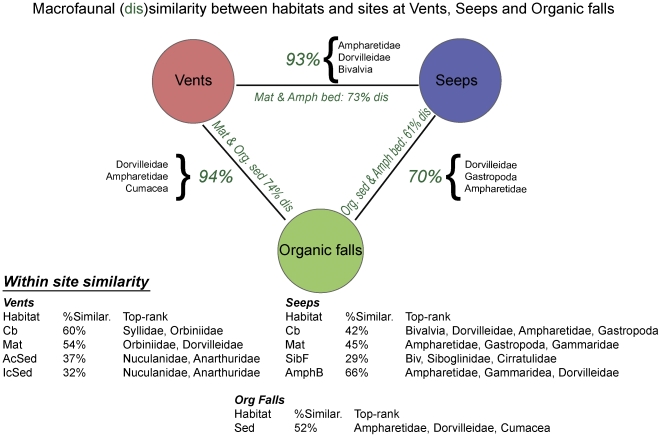
Sediments associated with hydrothermal venting, methane seepage and large organic falls such as whale, wood and plant detritus create deep-sea networks of soft-sediment habitats fueled, at least in part, by the oxidation of reduced chemicals. Biological studies at deep-sea vents, seeps and organic falls have looked at macrofaunal taxa, but there has yet to be a systematic comparison of the community-level attributes of sediment macrobenthos in various reducing ecosystems. Here we review key similarities and differences in the sediment-dwelling assemblages of each system with the goals of (1) generating a predictive framework for the exploration and study of newly identified reducing habitats, and (2) identifying taxa and communities that overlap across ecosystems. We show that deep-sea seep, vent and organic-fall sediments are highly heterogeneous. They sustain different geochemical and microbial processes that are reflected in a complex mosaic of habitats inhabited by a mixture of specialist (heterotrophic and symbiont-associated) and background fauna. Community-level comparisons reveal that vent, seep and organic-fall macrofauna are very distinct in terms of composition at the family level, although they share many dominant taxa among these highly sulphidic habitats. Stress gradients are good predictors of macrofaunal diversity at some sites, but habitat heterogeneity and facilitation often modify community structure. The biogeochemical differences across ecosystems and within habitats result in wide differences in organic utilization (i.e., food sources) and in the prevalence of chemosynthesis-derived nutrition. In the Pacific, vents, seeps and organic-falls exhibit distinct macrofaunal assemblages at broad-scales contributing to ß diversity. This has important implications for the conservation of reducing ecosystems, which face growing threats from human activities.


Conflict of interest statement

Competing Interests: The authors have declared that no competing interests exist.

Figures

Figure 1
Figure 1. Global distribution of known chemosynthetic ecosystems.
Colored dots represent quantitative faunal studies at hydrothermal vents (red), cold seeps (blue), and organic falls (green). Black dots indicate chemosynthetic sites used for comparisons only.
Figure 2
Figure 2. Macrofaunal density per habitat across Vents (upper panel), Seeps (middle panel), and Organic-Fall (lower panel) ecosystems.
Average values (±1 SE).
Figure 3
Figure 3. Macrofaunal composition within habitats in Vent, Seep and Organic-Fall ecosystems.
Values are relative abundance (%) of all samples within each habitat/site. Color-code: Polychaetes (patterns in black); Mollusks (in blue); Crustaceans (in red) and Other taxa (purple). Ampharetid beds represented only in New Zealand.
Figure 4
Figure 4. MDS plots of family-level abundance based on the Bray Curtis similarity index.
Panels A–C: Squares – Upper bathyal (Ub 200–1500 m); Circles – Lower bathyal (Lb 1501–3000 m); Triangles - Abyssal (Ab>3000 m) samples. Colors indicate habitats within sites: Light green - microbial mats (Mat), Dark blue - clam beds (Cb), Red - hot muds (Hm), Orange - active venting (Ac), Pink - inactive venting (Ic), Brown - frenulate beds (Pg), Yellow - ampharetid beds (Amph); Black - Background sediments. Panel D: Symbols indicate background samples (in black) in different basins (sites).
Figure 5
Figure 5. Rarefaction diversity at species level for vent (upper), seep (middle) and organic-fall (lower) habitats (cores pooled by site and habitat).
Colors indicate sites; Line patterns differentiate habitats within sites. Legend: Mat – microbial mats, Cb – clam beds, Sib – frenulate fields, Ab – ampharetids beds, Ac – active vent sediments, Ic – inactive vent sediments, Hm – vent hot muds, Of – organic-falls. Sites: MV – Middle Valley, MB – Manus Basin, ER – Eel River, HR – Hydrate Ridge, FL – Florida Escarpment, KD – Kodiak Alaska, UM – Unimark Aleutians, SC – San Clemente Basin, NZ- New Zealand, Ke – Kelp-fall, Wd – Wood-fall, Wh – Whale-fall.
Figure 6
Figure 6. A conceptual framework of factors shaping the biodiversity, density, and biomass of macrofauna in reducing ecosystems.
The top three panels highlight drivers that are unique to certain systems. The bottom two panels provide axes for features that are similar among systems (note that while values are given for these two axes the values are not consistent across the different ecosystems represented although the relative scale is). The middle panel illustrates how these factors translate into community attributes of each of the ecosystems. The bifurcation in the abundance and biomass factors indicate that, depending on the system, stress overrides high productivity in these habitats and both biomass and species richness fall bellow an intermediate level (e.g. hydrothermal sediments where the temperature stress overrides the importance of a high productivity system).
Figure 7
Figure 7. Diagram showing degree of community similarity or dissimilarity between chemosynthetic ecosystems and habitats.
Values outside bars denote average dissimilarity between sites with all habitats combined and taxa responsible for those differences. Values inside bars indicate the lowest dissimilarity between two habitats among the two sites compared. Legend: Green color – indicates dissimilarity percentages from SIMPER analysis.

References

    1. Somero GN, Childress JJ, Anderson AE. Transport, metabolism, and detoxification of hydrogen sulfide in animlas from sulfide-rich marine environments. CRC Crit Rev Aquat Sci. 1989;1:591–614.
    1. Bagarinao T. Sulfide as an environmental factor and toxicant: tolrrance and adaptation in aquatic organisms. Aquatic Toxicology. 1992;24:21–62.
    1. Smith CR, De Leo FC, Bernardino AF, Sweetman AK, Arbizu PM. Abyssal food limitation, ecosystem structure and climate change. Trends in ecology and evolution. 2008;23:518–528. - PubMed
    1. German CR, Ramirez-Llodra E, Baker MC, Tyler PA Committee CSS. Deep-Water Chemosynthetic Ecosystem Research during the Census of Marine Life Decade and Beyond: A Proposed Deep-Ocean Road Map. PLOS One. 2011;6:e23259. - PMC - PubMed
    1. Levin LA, Sibuet M. Understanding Continental Margin Biodiversity: A New Imperative. Annual Review of Marine Science. 2012;4:1–34. - PubMed

Publication types

Substances