Comparative Study
. 2012;7(4):e34318.
doi: 10.1371/journal.pone.0034318. Epub 2012 Apr 4.

Diagnostic significance of serum HMGB1 in colorectal carcinomas

Affiliations
Comparative Study

Diagnostic significance of serum HMGB1 in colorectal carcinomas

Hanna Lee et al. PLoS One. 2012.

Abstract

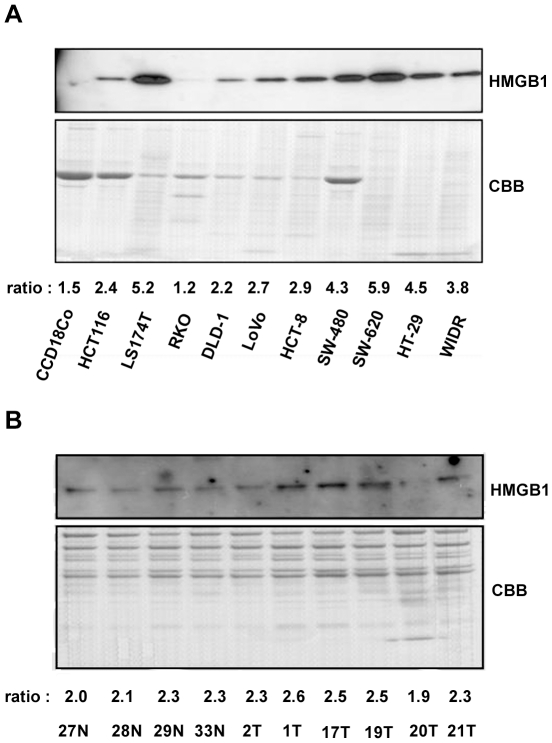
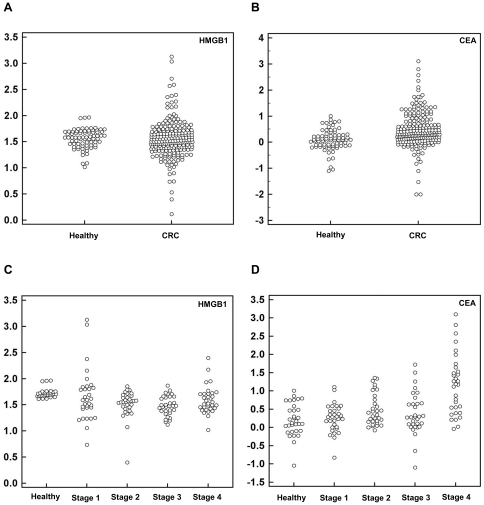
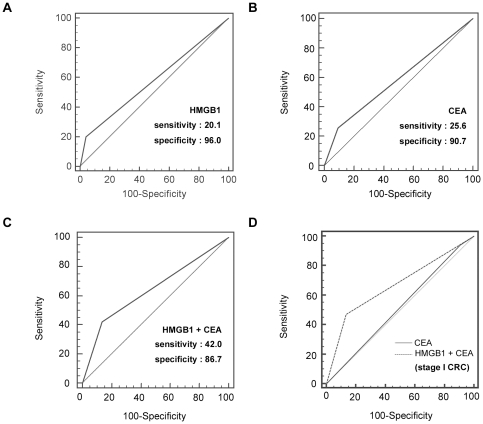
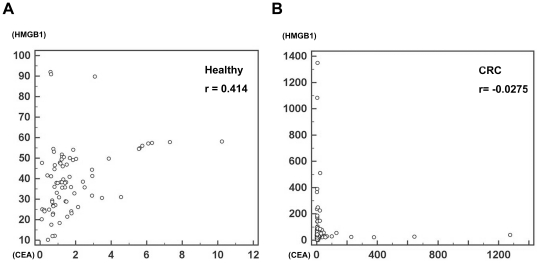
High mobility group box 1 protein (HMGB1), a nuclear protein, can be translocated to the cytoplasm and secreted in colon cancer cells. However, the diagnostic significance of HMGB1 has not been evaluated in colorectal carcinomas. For this purpose, we have screened the expression and secretion of HMGB1 in 10 colon cancer cell lines and 1 control cell line and found that HMGB1 was detected in the culture medium. To evaluate the diagnostic value of HMGB1, we performed an enzyme-linked immunosorbent assay to measure HMGB1 levels and compared them to carcinoembryonic antigen (CEA) levels in the serum samples of 219 colorectal carcinoma patients and 75 healthy control subjects. We found that the serum HMGB1 level was increased by 1.5-fold in patients with colorectal carcinoma compared to those in healthy controls. When HMGB1 and CEA levels were compared, HMGB1 had similar efficacy as CEA regarding cancer detection (the sensitivity was 20.1% for HMGB1 vs. 25.6% for CEA, and the specificity was 96% for HMGB1 vs. 90.7% for CEA). Moreover, the diagnostic accuracy of HMGB1 for stage I cancer was significantly higher than that of CEA (sensitivity: 41.2% vs. 5.9%; specificity: 96% vs. 90.7). When we combined HMGB1 and CEA, the overall diagnostic sensitivity was higher than that of CEA alone (42% vs. 25.6%), and the diagnostic sensitivity for stage I was also elevated (47% vs. 5.9%). However, the prognosis of patients was not related with serum HMGB1 concentrations. Our findings indicate that serum HMGB1 levels are increased in a subset of colorectal carcinomas, suggesting their potential utility as a supportive diagnostic marker for colorectal carcinomas.


Conflict of interest statement

Competing Interests: The authors have declared that no competing interests exist.

Figures

Figure 1
Figure 1. HMGB1 is secreted from colon cancer cells and detected in the blood of cancer patients.
HMGB1 in the culture media of colon cancer cells (A) and the sera of colorectal cancer patients (B) exhibited varying degrees of HMGB1 secretion. Culture media were collected, concentrated using a specified column, and the blood samples were depleted of the six most abundant proteins using a MARS column. (A) Normal colon fibroblast cell line CCD18Co did not secrete visible amounts of HMGB1 in the culture media; however most tumor cells secreted HMGB1 with slight differences between tumor cells. Coomassie Brilliant Blue staining indicated that equal amounts of proteins were loaded onto SDS-PAGE gels. (B) Human serum proteins were depleted, and HMGB1 secretion was examined. HMGB1 secretion was observed in both healthy controls and colorectal cancer patients, but elevated serum HMGB1 levels were noted in cancer patients. The numbers provided for the cases match those in our tissue bank database. N represents normal healthy controls, and T represents colorectal carcinoma tumor patients. Coomassie Brilliant Blue staining indicated that equal amounts of proteins were loaded onto SDS-PAGE gels. The ratio of HMGB1∶CBB was calculated by TINA program and depicted under the images.
Figure 2
Figure 2. Serum HMGB1 levels are increased in colorectal cancer patients.
The sera of 219 cancer patients were screened using HMGB1 ELISA, and the findings were compared with those of 75 non-cancerous healthy controls. Serum CEA levels were also measured in both groups. Each serum value was transferred to natural logarithm to draw a data comparison plot. (A) Serum HMGB1 levels were 1.5-fold higher in cancer patients than in healthy controls (the mean serum concentrations were 58.8±126.2 ng/mL in colorectal cancer patients and 39.7±16.2 ng/mL in control subjects). The P-value was calculated by the Welch's t-test ( = 0.03) (B) Serum CEA levels were elevated in cancer patients compared to those in healthy controls (the mean serum concentrations were 18.3±100.8 ng/mL in patients with colorectal carcinoma and 1.9±1.8 ng/mL in control subjects). The P-value was calculated by the Welch's t-test ( = 0.02) (C) HMGB1 concentrations were depicted according to different tumor stages. (D) CEA concentrations were depicted according to different tumor stages. CEA levels were elevated in advanced tumor stages.
Figure 3
Figure 3. ROC curves generated with serum CEA and HMGB1 levels.
To certify the utility of HMGB1 in the diagnosis of colorectal cancer, we used the ROC method to determine cutoff values. (A) ROC curve for HMGB1. At the cutoff value of 58.2 ng/mL, the sensitivity and specificity were 20.1% and 96%, respectively. Overall AUC was 0.580. (B) ROC curve for the CEA. The sensitivity and specificity were 25.6% and 90.7%, respectively. Overall AUC was 0.581. (C) ROC curve for the combination of HMGB1 and CEA. The sensitivity and specificity were 42.0% and 86.7%, respectively. Overall AUC was 0.643. (D) Comparison of combination of HMGB1 and CEA with CEA alone for stage I colorectal cancer. The overall AUC was higher for the combination of these two markers than for CEA alone. All of the reference lines were determined when the AUC was 0.5.
Figure 4
Figure 4. Correlation plot generated with serum CEA and HMGB1 levels.
To assess the relationship between serum CEA and HMGB1 levels for the correlation, we used the Spearman's rho method to determine the correlation coefficient r. (A) Correlation plot of 75 healthy subjects for CEA and HMGB1 serum expression levels. The correlation coefficient r was 0.414 (P = 0.0002) for the two values in healthy control group showing these two markers were positively correlated with each other. The X axis represents CEA levels and the Y axis represents HMGB1 levels, respectively. (B) Correlation plot of 219 colorectal carcinoma patients for CEA and HMGB1 serum expression levels. The correlation coefficient r was −0.0275 (P = 0.6858) for the two values in cancer patients demonstrating that these two markers seems to be negatively correlated with each other despite its low accuracy for this tendency. The X axis represents CEA levels and the Y axis represents HMGB1 levels, respectively.

Similar articles

Cited by

References

    1. Goodwin GH, Sanders C, Johns EW. A new group of chromatin-associated proteins with a high content of acidic and basic amino acids. Eur J Biochem. 1973;38:14–19. - PubMed
    1. Bustin M. Regulation of DNA-dependent activities by the functional motifs of the high-mobility-group chromosomal proteins. Mol Cell Biol. 1999;19:5237–5246. - PMC - PubMed
    1. Weir HM, Kraulis PJ, Hill CS, Raine AR, Laue ED, et al. Structure of the HMG box motif in the B-domain of HMG1. EMBO J. 1993;12:1311–1319. - PMC - PubMed
    1. Youn JH, Shin JS. Nucleocytoplasmic shuttling of HMGB1 is regulated by phosphorylation that redirects it toward secretion. J Immunol. 2006;177:7889–7897. - PubMed
    1. Bonaldi T, Talamo F, Scaffidi P, Ferrera D, Porto A, et al. Monocytic cells hyperacetylate chromatin protein HMGB1 to redirect it towards secretion. EMBO J. 2003;22:5551–5560. - PMC - PubMed

Publication types

MeSH terms