. 2012;7(4):e34687.
doi: 10.1371/journal.pone.0034687. Epub 2012 Apr 5.

Structural disorder in eukaryotes

Affiliations

Structural disorder in eukaryotes

Rita Pancsa et al. PLoS One. 2012.

Abstract

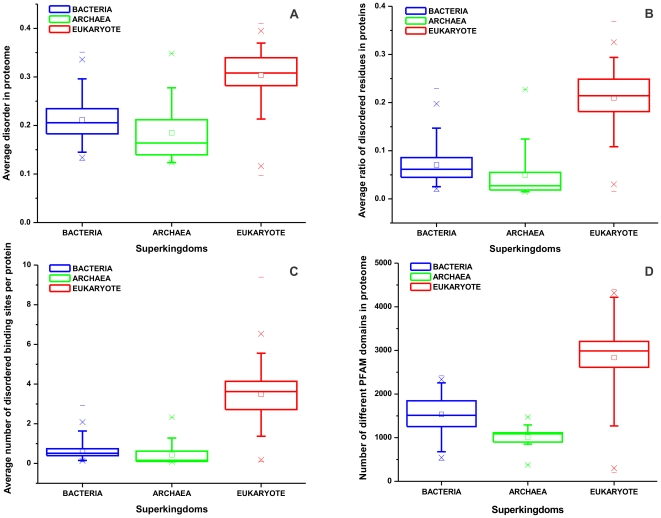
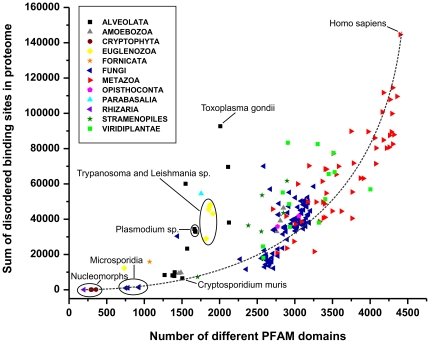
Based on early bioinformatic studies on a handful of species, the frequency of structural disorder of proteins is generally thought to be much higher in eukaryotes than in prokaryotes. To refine this view, we present here a comparative prediction study and analysis of 194 fully described eukaryotic proteomes and 87 reference prokaryotes for structural disorder. We found that structural disorder does distinguish eukaryotes from prokaryotes, but its frequency spans a very wide range in the two superkingdoms that largely overlap. The number of disordered binding regions and different Pfam domain types also contribute to distinguish eukaryotes from prokaryotes. Unexpectedly, the highest levels--and highest variability--of predicted disorder is found in protists, i.e. single-celled eukaryotes, often surpassing more complex eukaryote organisms, plants and animals. This trend contrasts with that of the number of domain types, which increases rather monotonously toward more complex organisms. The level of structural disorder appears to be strongly correlated with lifestyle, because some obligate intracellular parasites and endosymbionts have the lowest levels, whereas host-changing parasites have the highest level of predicted disorder. We conclude that protists have been the evolutionary hot-bed of experimentation with structural disorder, in a period when structural disorder was actively invented and the major functional classes of disordered proteins established.


Conflict of interest statement

Competing Interests: The authors have declared that no competing interests exist.

Figures

Figure 1
Figure 1. Structural features of the proteomes in the three superkingdoms.
Structural disorder was predicted by the IUPred algorithm , for all the proteins in the proteomes collected; the average disorder (A) and the ratio of disordered residues (B) were calculated for the three superkingdoms, Bacteria, Archaea and Eukaryote. Disordered binding sites (C) were predicted by the ANCHOR method and averaged for all proteins in all proteomes in the three superkingdoms. The search for Pfam domains (D) was carried out by the PfamScan algorithm . The number of different Pfam domains was calculated in all proteomes and averaged in the three superkingdoms. On every panel, the horizontal line in the box shows the median of the data, the mean is indicated by a small square, and the upper and lower edge of the box indicates the 75 and 25% of the data, respectively. The upper and lower error bars show the 90 and 10% of the data respectively, the upper and lower cross represents 99% and 1% of the data, while the maximum and minimum value within the dataset is indicated by short horizontal lines.
Figure 2
Figure 2. Ratio of disordered residues in the proteins of eukaryotic proteomes.
On the main plot the average ratio of disordered residues (with an IUPred score ≥0.5) in proteins of all eukaryotic proteomes is shown as a function of the number of proteins in the given proteome. Large phylogenetic groups are indicated with different colors, as defined on a small plate. In the insert, the average and standard deviation for the different groups is given, by applying the same color code as in the main plot.
Figure 3
Figure 3. Number of different Pfam domains in eukaryotic proteomes.
Pfam domains were predicted for all eukaryotic proteomes with PfamScan . On the main plot the number of different types of Pfam domains is shown as a function of the number of proteins in the given proteome. Large phylogenetic groups are indicated with different colors, as defined on a small plate. In the insert, the average and standard deviation for the different groups are given, by applying the same color code as in the main plot.
Figure 4
Figure 4. The interplay of structural disorder and Pfam domain types.
The average ratio of disordered residues (with a score ≥0.5) in proteins of the eukaryotic proteomes, is shown as a function of the number of different Pfam domains found. Large phylogenetic groups are color coded, as defined on a small plate. The linear fit of the data is shown as a dashed line. Certain species are named and certain groups are encircled and marked, as explained and discussed in the text.
Figure 5
Figure 5. The ratio of structural disorder within and outside Pfam domains.
The average ratio of disordered residues (with a score ≥0.5) in proteins of the eukaryotic proteomes, within regions outside Pfam domains is shown as a function the same value within Pfam domains. Large phylogenetic groups are color coded, as defined on a small plate. The linear function showing a parallel increase of disorder within and outside Pfam domains in most species is marked by a dashed line. Certain groups of species show significant deviation from this linear dependence, as explained and discussed in the text.
Figure 6
Figure 6. Number of disordered binding sites in eukaryotic proteomes.
The overall number of predicted disordered binding sites in eukaryotic proteomes predicted by the ANCHOR algorithm is shown as function of the number of different Pfam domains. Large phylogenetic groups are color coded, as defined on a small plate. Certain species and certain groups are marked and/or named, as explained and discussed in the text. The increasing (exponential) function marked by the dashed line is no fit by any model, it is only drawn to guide the eye. Homo sapiens has a larger apparent proteome size, because it has been analyzed at greater depth and the number of identified isoforms exceeds that of other mammals even after sequence identity filtering.

References

    1. Dyson HJ, Wright PE. Intrinsically unstructured proteins and their functions. Nat Rev Mol Cell Biol. 2005;6:197–208. - PubMed
    1. Tompa P. Unstructural biology coming of age. Curr Opin Struct Biol. 2011;21:419–425. - PubMed
    1. Uversky VN, Dunker AK. Understanding protein non-folding. Biochim Biophys Acta. 2010;1804:1231–1264. - PMC - PubMed
    1. Tompa P, Szasz C, Buday L. Structural disorder throws new light on moonlighting. Trends Biochem Sci. 2005;30:484–489. - PubMed
    1. Wright PE, Dyson HJ. Linking folding and binding. Curr Opin Struct Biol. 2009;19:1–8. - PMC - PubMed

Publication types