

HIV-1 phenotypic reverse transcriptase inhibitor drug resistance test interpretation is not dependent on the subtype of the virus backbone
- PMID: 22496845
- PMCID: PMC3322145
- DOI: 10.1371/journal.pone.0034708
HIV-1 phenotypic reverse transcriptase inhibitor drug resistance test interpretation is not dependent on the subtype of the virus backbone
Abstract
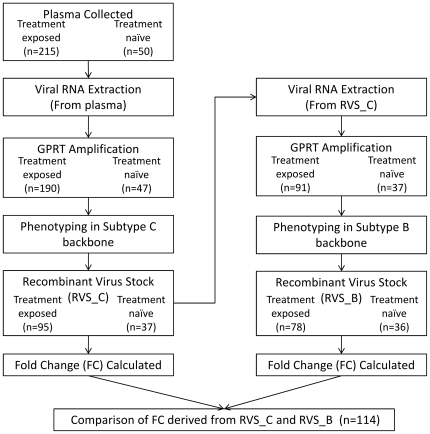
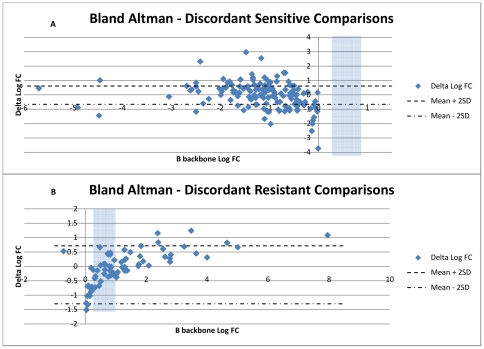
To date, the majority of HIV-1 phenotypic resistance testing has been performed with subtype B virus backbones (e.g. HXB2). However, the relevance of using this backbone to determine resistance in non-subtype B HIV-1 viruses still needs to be assessed. From 114 HIV-1 subtype C clinical samples (36 ARV-naïve, 78 ARV-exposed), pol amplicons were produced and analyzed for phenotypic resistance using both a subtype B- and C-backbone in which the pol fragment was deleted. Phenotypic resistance was assessed in resulting recombinant virus stocks (RVS) for a series of antiretroviral drugs (ARV's) and expressed as fold change (FC), yielding 1660 FC comparisons. These Antivirogram® derived FC values were categorized as having resistant or sensitive susceptibility based on biological cut-off values (BCOs). The concordance between resistance calls obtained for the same clinical sample but derived from two different backbones (i.e. B and C) accounted for 86.1% (1429/1660) of the FC comparisons. However, when taking the assay variability into account, 95.8% (1590/1660) of the phenotypic data could be considered as being concordant with respect to their resistance call. No difference in the capacity to detect resistance associated with M184V, K103N and V106M mutations was noted between the two backbones. The following was concluded: (i) A high level of concordance was shown between the two backbone phenotypic resistance profiles; (ii) Assay variability is largely responsible for discordant results (i.e. for FC values close to BCO); (iii) Confidence intervals should be given around the BCO's, when assessing resistance in HIV-1 subtype C; (iv) No systematic resistance under- or overcalling of subtype C amplicons in the B-backbone was observed; (v) Virus backbone subtype sequence variability outside the pol region does not contribute to phenotypic FC values. In conclusion the HXB2 virus backbone remains an acceptable vector for phenotyping HIV-1 subtype C pol amplicons.
Conflict of interest statement
Figures
References
-
- WHOUNICEFUNAIDS. Towards universal access. Scaling up priority HIV/AIDS interventions in the health sector. Geneva, World Health Organization. 2010 Available: http://www.who.int/hiv/pub/2010progressreport/full_report_en.pdf. Accessed 28 May 2011.
-
- Hamers RL, Derdelinckx I, van Vugt M, Stevens W, Rinke de Wit TR, et al. The status of HIV-1 resistance to antiretroviral drugs in sub-Saharan Africa. Antiviral Therapy. 2008;13:625–639. - PubMed
-
- Hamers RL, Wallis CL, Kityo C, Siwale M, Mandaliya K, et al. HIV-1 drug resistance in antiretroviral-naive individuals in sub-Saharan Africa after rollout of antiretroviral therapy: a multicentre observational study. Lancet Infect Dis Jul. 2011:27. - PubMed
Publication types
MeSH terms
Substances
LinkOut - more resources
Full Text Sources
Medical
Miscellaneous
