Review
. 2012 May;22(3):380-401.
doi: 10.1111/j.1750-3639.2012.00581.x.

Malformations of cortical development

Affiliations
Review

Malformations of cortical development

Eleonora Aronica et al. Brain Pathol. 2012 May.

Abstract

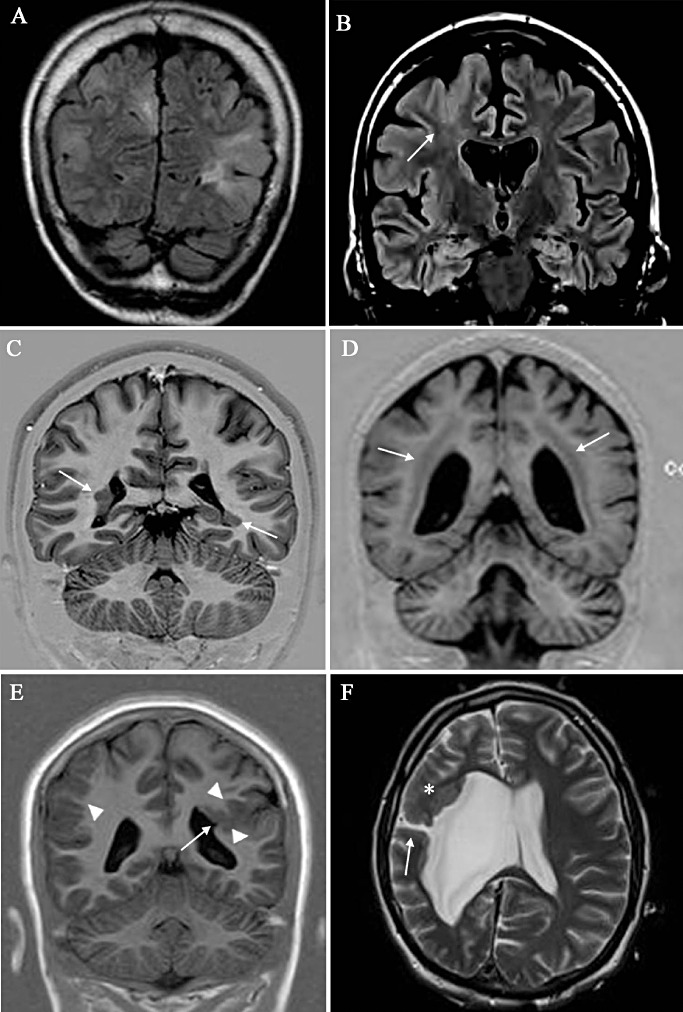
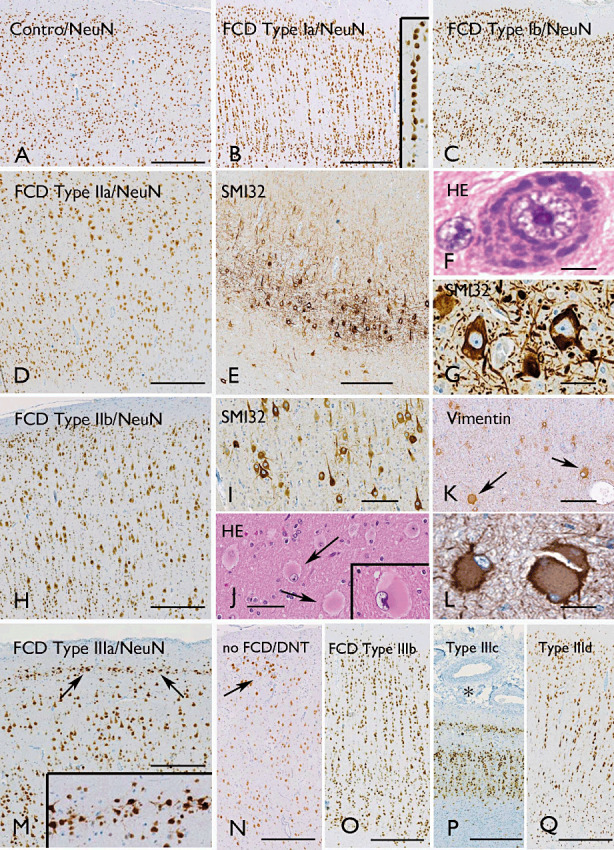
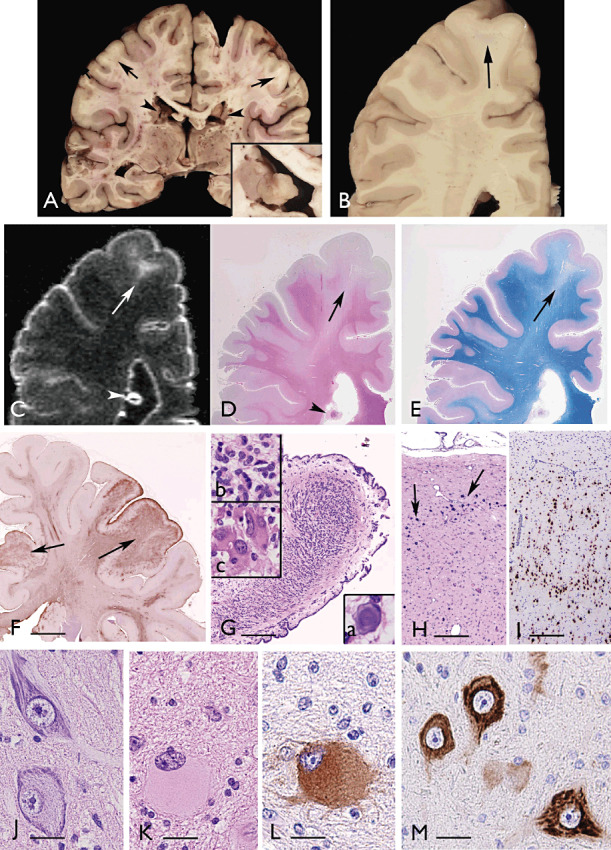
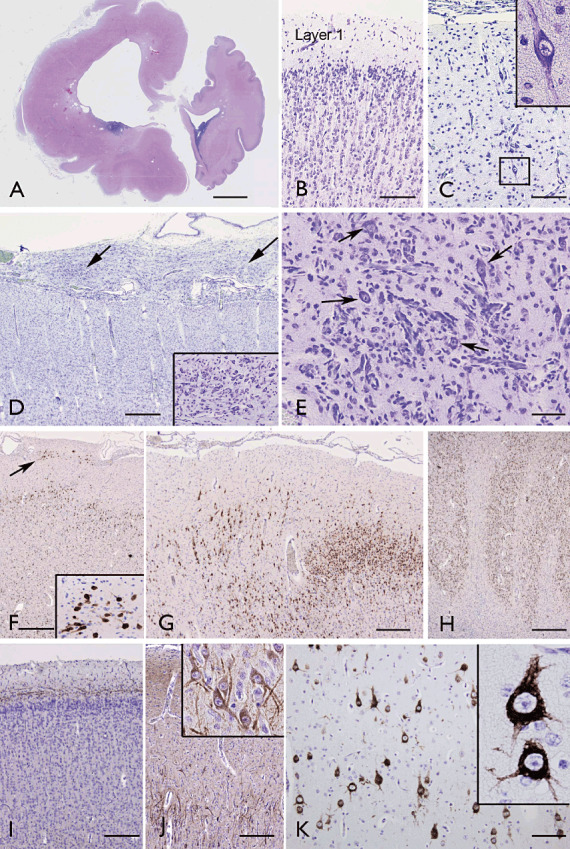
Structural abnormalities of the brain are increasingly recognized in patients that suffer from pharmacoresistant focal epilepsies by applying high-resolution imaging techniques. In many of these patients, epilepsy surgery results in control of seizures. Neuropathologically, a broad spectrum of malformations of cortical development (MCD) is observed in respective surgical brain samples. These samples provide a unique basis to further understand underlying pathomechanisms by molecular approaches and develop improved diagnostics and entirely new therapeutic perspectives. Here we provide a comprehensive description of neuropathological findings, available classification systems as well as molecular mechanisms of MCDs. We emphasize the recently published ILEA classification system for focal cortical dysplasias (FCDs), which are now histopathologically distinguished as types I to III. However, this revised classification system represents a major challenge for molecular neuropathologists, as the underlying pathomechanisms in virtually all FCD entities will need to be specified in detail. The fact that only recently, the mammalian target of rapamycin (mTOR)-antagonist Everolimus has been introduced as a treatment of epilepsies in the context of tuberous sclerosis-associated brain lesions is a striking example of a successful translational "bedside to bench and back" approach. Hopefully, the exciting clinico-pathological developments in the field of MCDs will in short term foster further therapeutic breakthroughs for the frequently associated medically refractory epilepsies.


Figures

Figure 1
Figure 1
MRI revealing different types of MCD. A. Multiple bilateral nodules in a patient with TSC. B. FCD Type IIb (histologically proven) in the right frontal area; note the tapering from the sulcus toward the ventricle (arrow) considered a landmark for this type of dysplasia. C. Bilateral asymmetric periventricular nodular heterotopia (arrows). D. Bilateral symmetric band heterotopia (double cortex). E. Close‐lipped schizencephaly (arrow) associated with polymicrogyria (arrowheads); a polymicrogyric cortex is also evident in the contralateral cortex (arrowhead). F. Open‐lipped schizencephaly with communication with an enlarged right ventricle (arrow); a malformed cortex is also evident (asterisk) in the frontal cortex of the same side. FCD = focal cortical dysplasia; MCD = malformation of cortical development; MRI = magnetic resonance imaging; TSC = tuberous sclerosis complex.
Figure 2
Figure 2
FCD variants. ILAE classification system 19, 23: A. Normal appearing neocortex (NeuN). B. Microcolumnar arrangements of small diameter neurons in FCD type Ia (NeuN); microcolumns are composed of more than eight neurons (insert in B). C. Abnormal cortical layering affecting the 6‐layered tangential organization of the neocortex in FCD Type Ib (NeuN). D–G. FCD Type IIA with cortical dyslamination (D, NeuN) and dysmorphic neurons with enlarged nuclei and aggregates of Nissl substance (F, H&E), as well as accumulation of nonphosphorylated neurofilaments (E, G; antibody SMI32). H–L. FCD Type IIb with cortical dyslamination (H, NeuN), dysmorphic neurons with accumulation of nonphosphorylated neurofilaments (I, antibody SMI32) and balloon cells (J, H&E, arrows and insert; K, L, vimentin, arrows in K). M. FCD Type IIIa with the characteristic abnormal Layer II (NeuN, arrows and insert in M). N. Neocortex adjacent to a dysembryoplastic neuroepithelial tumor (DNT) with clear cell tumor infiltrates that disrupt the cortical architecture (NeuN, no FCD); O. Neocortex adjacent to a DNT with microcolumnar arrangements, but without tumor infiltration (FCD Type IIIb, NeuN). P. Abnormal cortical architecture in a patient with meningioangiomatosis (FCD Type IIIc, NeuN). Q. Abnormal cortical architecture adjacent to a glial scar (NeuN). Scale bar in A: A–E, H, M–Q: 500 µm; I, K: 160 µm; J: 80 µm; G, L: 40 µm; F: 12 µm. FCD = focal cortical dysplasia; H&E = hematoxylin and eosin; ILAE = International League Against Epilepsy; NeuN = neuronal nuclear antigen.
Figure 3
Figure 3
Tuberous sclerosis. Panel A,B. Coronal sections of the brain (32‐year‐old patient with a germline mutation in the TSC2 gene; (26)), showing several regions with blurring of the cortex/white matter junction (arrows) and subependymal nodules (SENs; arrowheads and insert in A). Panel C. Post‐mortem MRI; 3D‐FLAIR image, showing the hyperintense tuber (arrow), as well as SEN with calcifications (arrowhead). Panels D,E. Histologic stains [D: hematoxylin and eosin (H&E) and E: Luxol fast blue‐PAS‐staining]. Note the cortical tuber (arrows in D and E) with decreased density of myelinated fibers (E) and the calcified SEN (arrowhead in D). Panel F. Low magnification view showing strong GFAP immunoreactivity within cortical tubers (arrows). Panel G. H&E stain showing a low magnification image of a SEN appearing as an oval‐shaped compact and calcified lesion, with overlying ependyma, projecting into the lateral ventricle; insert a in G: calcification; inserts b–c: high‐magnification microphotographs of H&E stain showing the cellular components of a SEN, including relatively small, plump glial cells with eosinophilic cytoplasm (b) and giant aberrant cells with large nuclei displaying different size and shape (c). Panel H. H&E stain of cortical tubers showing the disorganized cortical cytoarchitecture with multiple punctate calcifications (arrows). Panel I. NeuN stain showing the disorganization of the neuronal component within the cortical tuber. Panel J. Dysmorphic neurons. Panel K. Giant cell with pale eosinophilic cytoplasm and balloon‐like appearance. Panels L,M. Microphotographs showing strong phospho‐S6 ribosomal protein (pS6) immunoreactivity in a giant cell within the subcortical white matter (L), and in dysmorphic neurons within the dysplastic cortex (M). Scale bars: F: 0.8 cm; G: 400 µm; H–I: 300 µm; JM: 40 µm. MRI = magnetic resonance imaging; NeuN = neuronal nuclear antigen.
Figure 4
Figure 4
Hemimegalencephaly (HMEG). A. Coronal section showing diffuse and severe hyperthrophy of the left hemisphere with lateral ventricular dilatation, periventricular cysts, pachygyria and thickened cortex (32 weeks gestation; HMEG plus epidermal nevus (24). Panels B–D. Clear difference in the architecture of the cortex between the right side (“normal” side; B, cresyl violet) and the affected left side (HMEG; C, D, cresyl violet). HMEG side (C and D) shows severe cortical disorganization with loss of lamination and presence of cytomegalic neurons (insert in C) and thickened leptomeninges with clusters of heterotopic cells (arrows and insert in D). Panel E shows (arrows) a cluster of dysmorphic neurons within the affected cortex (cresyl violet). Panels F,G. (NeuN in HMEG cortex): loss of lamination with irregular distribution of neuronal cells and clusters of NeuN‐positive elements in Layer I (arrow and insert in F). H. NeuN staining in the occipital HMEG cortex with polymicrogyria. I,J. Neurofilament immunoreactivity in the unaffected (I) and affected (J) cortex, showing intense cytoplasmic staining in dysmorphic neurons (J). K. Phospho‐S6 ribosomal protein (pS6) staining; strong positivity is observed in a population of dysmorphic neurons within the affected cortex (K and insert). Scale bars: A: 1028 mm; B–C: 250 µm; D: 400 µm; E: 125 µm; F–H: 400 µm; I–J 250 µm; K: 200 µm. NeuN = neuronal nuclear antigen.
Figure 5
Figure 5
Type II lissencephaly. Fetal brain at 22 weeks of gestation with Walker–Warburg syndrome (POMT1 mutation). A. Post‐mortem MRI (hydrocephalus); B. External view of the brain. C. (H&E) cortical plate showing focal disruption of the pia‐glial limitans (arrows) with overmigration of cells into the leptomeninges (asterisk; high magnification in insert). D. Vimentin staining showing the multiple breaches of the pia‐glial limitans (arrows; high magnification in insert). Scale bars: A: 240 µM; B: 120 µM. H&E = hematoxylin and eosin; MRI = magnetic resonance imaging.
Figure 6
Figure 6
Heterotopia. A,B. Thionin stained and neurofilament immunostained coronal serial sections (asterisk is indicating the same nodule) from a surgical specimen showing multiple subcortical nodules. Note that the overlying cortex appears disorganized and no lamination can be detected. C. Low‐power photomicrograph of a Luxol fast blue‐stained section of occipital cortex, white matter, subependymal region with nodular formations around the ventricle and overlying cortex. D. High‐magnification detail of one of the nodules in C (square). E,F show two serial coronal sections immunostained with NeuN and MAP2 respectively from a patient with “double cortex.” The heterotopic band consists of unlayered cortex with haphazardly organized neurons. The white matter between the “outer” and “inner” cortex contains abundant heterotopic neurons arranged in columns. MAP2 = microtubule‐associated protein 2; NeuN = neuronal nuclear antigen.

Similar articles

Cited by

References

    1. Adriaensen ME, Schaefer‐Prokop CM, Stijnen T, Duyndam DA, Zonnenberg BA, Prokop M (2009) Prevalence of subependymal giant cell tumors in patients with tuberous sclerosis and a review of the literature. Eur J Neurol 16:691–696. - PubMed
    1. Aghakhani Y, Kinay D, Gotman J, Soualmi L, Andermann F, Olivier A et al (2005) The role of periventricular nodular heterotopia in epileptogenesis. Brain 128:641–651. - PubMed
    1. Aida N (1998) Fukuyama congenital muscular dystrophy: a neuroradiologic review. J Magn Reson Imaging 8:317–326. - PubMed
    1. Al‐Saleem T, Wessner LL, Scheithauer BW, Patterson K, Roach ES, Dreyer SJ et al (1998) Malignant tumors of the kidney, brain, and soft tissues in children and young adults with the tuberous sclerosis complex. Cancer 83:2208–2216. - PubMed
    1. Anderl S, Freeland M, Kwiatkowski DJ, Goto J (2011) Therapeutic value of prenatal rapamycin treatment in a mouse brain model of tuberous sclerosis complex. Hum Mol Genet 20:4597–4604. - PMC - PubMed

Publication types

MeSH terms