Review
. 2012;76(5):1054-65.
doi: 10.1253/circj.cj-12-0284. Epub 2012 Apr 11.

Genetic, molecular and cellular mechanisms underlying the J wave syndromes

Affiliations
Review

Genetic, molecular and cellular mechanisms underlying the J wave syndromes

Charles Antzelevitch. Circ J. 2012.

Abstract

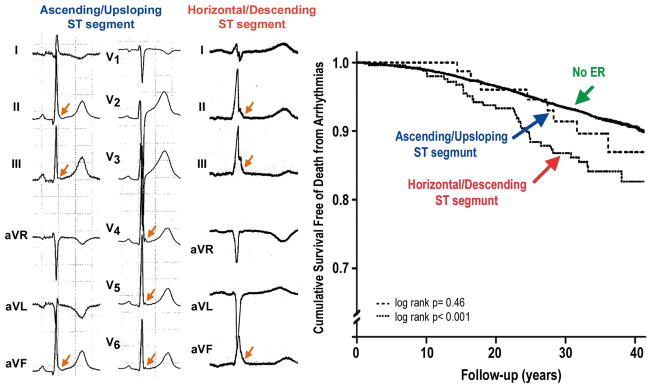
An early repolarization (ER) pattern in the ECG, distinguished by J-point elevation, slurring of the terminal part of the QRS and ST-segment elevation has long been recognized and considered to be a benign electrocardiographic manifestation. Experimental studies conducted over a decade ago suggested that some cases of ER may be associated with malignant arrhythmias. Validation of this hypothesis was provided by recent studies demonstrating that an ER pattern in the inferior or inferolateral leads is associated with increased risk for life-threatening arrhythmias, termed ER syndrome (ERS). Because accentuated J waves characterize both Brugada syndrome (BS) and ERS, these syndromes have been grouped under the term "J wave syndromes". ERS and BS share similar ECG characteristics, clinical outcomes and risk factors, as well as a common arrhythmic platform related to amplification of I(to)-mediated J waves. Although BS and ERS differ with respect to the magnitude and lead location of abnormal J wave manifestation, they can be considered to represent a continuous spectrum of phenotypic expression. Although most subjects exhibiting an ER pattern are at minimal to no risk, mounting evidence suggests that careful attention should be paid to subjects with "high risk" ER. The challenge ahead is to be able to identify those at risk for sudden cardiac death. Here I review the clinical and genetic aspects as well as the cellular and molecular mechanisms underlying the J wave syndromes.


Conflict of interest statement

Disclosures

Conflicts of Interest: There are no conflicts of interest to disclose.

Figures

Figure 1
Figure 1
Horizontal ST segment is associated with higher risk for arrhythmic sudden death. (Left panel) 12-lead ECG of a young athlete with early repolarization (ER) showing a rapidly ascending/upsloping ST-segment morphology. All but 1 subject presenting with an ER pattern in the Finnish athlete population had similarly rapidly ascending ST segments after the J point. Both terminal QRS notching and slurring are present (arrows), but only 1 of the 27 cases with ER had a dominant ST segment categorized as horizontal/descending. (Middle panel) Limb and augmented leads of an ER syndrome patient showing horizontal ST segment in leads II and aVF and descending ST segment in lead III. In the middle-aged general population, only ER with a horizontal/descending ST segment predicted arrhythmic death. Arrows indicate terminal QRS notching or slurring. (Right panel) Unadjusted Kaplan-Meier estimates. (Modified from Tikkanen et al, with permission.)
Figure 2
Figure 2
Relationship between the spike and dome morphology of the epicardial (Epi) action potential (AP) and the appearance of the J wave. ECG2 is a lead V5 ECG recorded in vivo from a dog. ECG1 is a transmural ECG recorded across the arterially-perfused left ventricular wedge isolated from the heart of the same dog. Both display a prominent J wave at the R-ST junction (arrows). The 2 upper traces are transmembrane APs simultaneously recorded from the Epi and M regions using floating microelectrodes. The preparation was paced at a basic cycle length of 4,000 ms. The sinus cycle length at the time ECG2 was recorded was 500 ms. The ECG J wave is temporally coincident with the notch of the Epi AP. Although the M cell AP also exhibits a prominent notch, it occurs too early to exert an important influence on the manifestation of the J wave. (Modified from Yan and Antzelevitch, with permission.)
Figure 3
Figure 3
Hypothermia-induced J wave. Each panel shows transmembrane action potentials (AP) from the epicardial (Epi) and endocardial (Endo) regions of an arterially-perfused canine left ventricular wedge and a transmural ECG simultaneously recorded. (A) Relatively small AP notch (APN) in the epicardium but not the endocardium is associated with an elevated J point at the R-ST junction (arrow) at 36°C. (B) Decrease in the temperature of the perfusate to 29°C results in an increase in the amplitude and width of the APN in the epicardium but not in the endocardium, leading to the development of a transmural voltage gradient that manifests as a prominent J wave on the ECG (arrow).
Figure 4
Figure 4
Effect of premature stimulation on the relationship between epicardial (Epi) action potential notch (APN) notch amplitude and J wave amplitude. (A) Simultaneous recording of a transmural ECG and transmembrane APs from the Epi and endocardial (Endo) regions of an isolated arterially-perfused right ventricular wedge. A significant APN in the epicardium is associated with a prominent J wave (arrow) during basic stimulation (S1–S1: 4,000 ms). Premature stimulation (S1–S2: 300 ms) causes a parallel decrease in the amplitude of Epi APN and that of the J wave (arrow). (B) Plot of the amplitudes of the Epi APN (open circles) and J wave (open squares) as a function of the S1–S2 interval. The amplitude of the Epi APN and that of J wave are normalized to the value recorded at an S1–S2 interval of 900 ms. (Modified from Yan and Antzelevitch, with permission.)
Figure 5
Figure 5
Cellular basis for electrocardiographic and arrhythmic manifestation of Brugada syndrome (BS). Each panel shows transmembrane action potentials (AP) from 1 endocardial (Endo) (Top) and 2 epicardial (Epi) sites together with a transmural ECG recorded from a canine coronary-perfused right ventricular wedge preparation. (A) Control (basic cycle length=400 ms). (B) Combined sodium- and calcium-channel blockade with terfenadine (5 μmol/L) accentuates the Epi AP notch, creating a transmural voltage gradient that manifests as an exaggerated J wave or ST segment elevation in the ECG. (C) Continued exposure to terfenadine results in all-or-none repolarization at the end of phase 1 at some Epi sites but not others, creating a local Epi dispersion of repolarization (EDR) as well as a transmural dispersion of repolarization (TDR). (D) Phase 2 reentry occurs when the Epi AP dome propagates from a site where it is maintained to regions where it has been lost, giving rise to a closely-coupled extra-systole. (E) Extrastimulus (S1–S2=250 ms) applied to the epicardium triggers a polymorphic ventricular tachycardia (VT). (F) Phase 2 reentrant extrasystole triggers a brief episode of polymorphic VT. (Modified from Fish and Antzelevitch, with permission.)
Figure 6
Figure 6
Cellular basis of early repolarization syndrome (ERS). (A) Surface ECG (lead V5) recorded from a 17-year-old healthy African-American male. Note the presence of a small J wave and marked ST-segment elevation. (B) Simultaneous recording of transmembrane action potentials (APs) from epicardial (Epi) and endocardial (Endo) regions and a transmural ECG in an isolated arterially-perfused canine left ventricular wedge. A J wave in the transmural ECG is manifest because of the presence of an AP notch in the epicardium but not the endocardium. Pinacidil (2 μmol/L), an ATP-sensitive potassium-channel opener, causes depression of the AP dome in the epicardium, resulting in ST-segment elevation in the ECG resembling ERS. (C) IK-ATP activation in the canine right ventricular wedge preparation using 2.5 umol/L pinacidil produces heterogeneous loss of the AP dome in the epicardium, resulting in ST-segment elevation, phase 2 reentry and ventricular tachycardia or ventricular fibrillation (VT/VF) (BS phenotype). (D) The Ito blocker, 4-aminopyridine (4-AP), restores the Epi AP dome, reduces both transmural and Epi dispersion of repolarization, normalizes the ST segment and prevents phase 2 reentry and VT/VF in the continued presence of pinacidil. (Modified from Antzelevitch and Yan, with permission.)
Figure 7
Figure 7
J wave syndromes. Schematic depicting a working hypothesis that an outward shift in repolarizing current caused by a decrease in sodium- or calcium-channel currents or an increase in Ito, IK-ATP or IK-ACh or other outward currents can give rise to accentuated J waves associated with the Brugada syndrome and early re-polarization syndrome (ERS). Both are thought to be triggered by closely-coupled phase 2 reentrant extrasystoles, but in the case of ERS a Purkinje source of ectopic activity is also suspected. (Modified from Antzelevitch and Yan, with permission.)

References

    1. Tomaszewski W. Changement electrocardiographiques observes chez un homme mort de froid. Arch Mal Coeur Vaiss. 1938;31:525–528. (in French)
    1. Osborn JJ. Experimental hypothermia: Respiratory and blood pH changes in relation to cardiac function. Am J Physiol. 1953;175:389–398. - PubMed
    1. Clements SD, Hurst JW. Diagnostic value of ECG abnormalities observed in subjects accidentally exposed to cold. Am J Cardiol. 1972;29:729–734. - PubMed
    1. Thompson R, Rich J, Chmelik F, Nelson WL. Evolutionary changes in the electrocardiogram of severe progressive hypothermia. J Electrocardiol. 1977;10:67–70. - PubMed
    1. Eagle K. Images in clinical medicine: Osborn waves of hypothermia. N Engl J Med. 1994;10:680. - PubMed

Publication types