

Mass spectrometry imaging and profiling of single cells
- PMID: 22498881
- PMCID: PMC3419297
- DOI: 10.1016/j.jprot.2012.03.017
Mass spectrometry imaging and profiling of single cells
Abstract
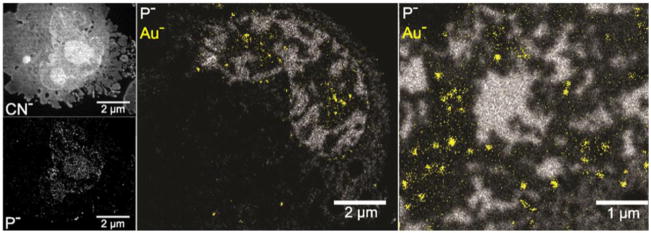
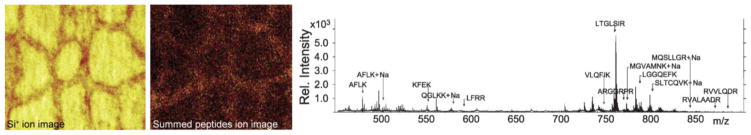
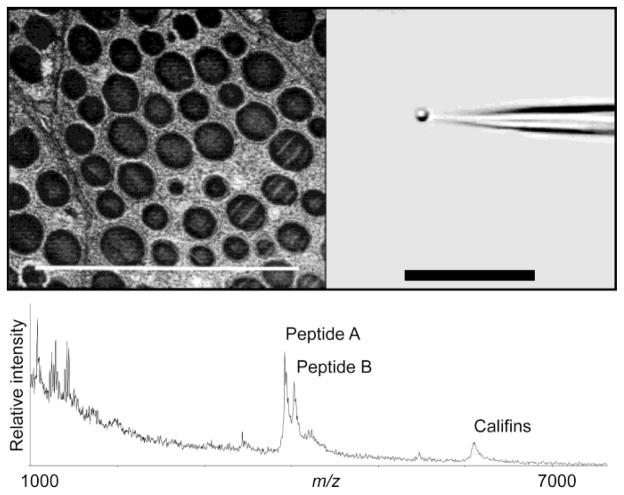
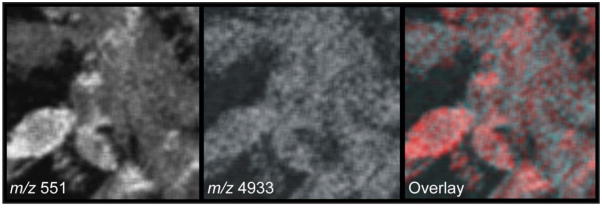
Mass spectrometry imaging and profiling of individual cells and subcellular structures provide unique analytical capabilities for biological and biomedical research, including determination of the biochemical heterogeneity of cellular populations and intracellular localization of pharmaceuticals. Two mass spectrometry technologies-secondary ion mass spectrometry (SIMS) and matrix assisted laser desorption/ionization mass spectrometry (MALDI MS)-are most often used in micro-bioanalytical investigations. Recent advances in ion probe technologies have increased the dynamic range and sensitivity of analyte detection by SIMS, allowing two- and three-dimensional localization of analytes in a variety of cells. SIMS operating in the mass spectrometry imaging (MSI) mode can routinely reach spatial resolutions at the submicron level; therefore, it is frequently used in studies of the chemical composition of subcellular structures. MALDI MS offers a large mass range and high sensitivity of analyte detection. It has been successfully applied in a variety of single-cell and organelle profiling studies. Innovative instrumentation such as scanning microprobe MALDI and mass microscope spectrometers enables new subcellular MSI measurements. Other approaches for MS-based chemical imaging and profiling include those based on near-field laser ablation and inductively-coupled plasma MS analysis, which offer complementary capabilities for subcellular chemical imaging and profiling.
Copyright © 2012 Elsevier B.V. All rights reserved.
Conflict of interest statement
The authors declare they have no conflicts of interest.
Figures
References
-
- Castaing R, Slodzian G. Microanalyse par emission ionique secondaire. J Microscopie. 1962;1:395–410.
-
- Caprioli RM, Farmer TB, Gile J. Molecular imaging of biological samples: Localization of peptides and proteins using MALDI-TOF MS. Anal Chem. 1997;69:4751–60. - PubMed
-
- Wiseman JM, Ifa DR, Song Q, Cooks RG. Tissue imaging at atmospheric pressure using desorption electrospray ionization (DESI) mass spectrometry. Angew Chem Int Ed. 2006;45:7188–92. - PubMed
-
- Kertesz V, Ford MJ, Van Berkel GJ. Automation of a surface sampling probe/electrospray mass spectrometry system. Anal Chem. 2005;77:7183–9. - PubMed
Publication types
MeSH terms
Grants and funding
LinkOut - more resources
Full Text Sources
Other Literature Sources
