. 2012 Sep 7;9(74):2365-82.
doi: 10.1098/rsif.2012.0080. Epub 2012 Apr 12.

Digital clocks: simple Boolean models can quantitatively describe circadian systems

Affiliations

Digital clocks: simple Boolean models can quantitatively describe circadian systems

Ozgur E Akman et al. J R Soc Interface. .

Erratum in

  • J R Soc Interface. 2012 Dec 7;9(77):3578

Abstract

The gene networks that comprise the circadian clock modulate biological function across a range of scales, from gene expression to performance and adaptive behaviour. The clock functions by generating endogenous rhythms that can be entrained to the external 24-h day-night cycle, enabling organisms to optimally time biochemical processes relative to dawn and dusk. In recent years, computational models based on differential equations have become useful tools for dissecting and quantifying the complex regulatory relationships underlying the clock's oscillatory dynamics. However, optimizing the large parameter sets characteristic of these models places intense demands on both computational and experimental resources, limiting the scope of in silico studies. Here, we develop an approach based on Boolean logic that dramatically reduces the parametrization, making the state and parameter spaces finite and tractable. We introduce efficient methods for fitting Boolean models to molecular data, successfully demonstrating their application to synthetic time courses generated by a number of established clock models, as well as experimental expression levels measured using luciferase imaging. Our results indicate that despite their relative simplicity, logic models can (i) simulate circadian oscillations with the correct, experimentally observed phase relationships among genes and (ii) flexibly entrain to light stimuli, reproducing the complex responses to variations in daylength generated by more detailed differential equation formulations. Our work also demonstrates that logic models have sufficient predictive power to identify optimal regulatory structures from experimental data. By presenting the first Boolean models of circadian circuits together with general techniques for their optimization, we hope to establish a new framework for the systematic modelling of more complex clocks, as well as other circuits with different qualitative dynamics. In particular, we anticipate that the ability of logic models to provide a computationally efficient representation of system behaviour could greatly facilitate the reverse-engineering of large-scale biochemical networks.


Figures
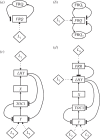
Figure 1.
Figure 1.
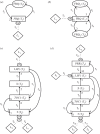
Circuit diagrams for the clock models. Genes are boxed and arrows denote regulatory interactions. Diamonds represent light inputs. (a) The single-loop Neurospora model [19]. FRQ protein represses production of frq transcript. Light acts on the network by upregulating frq transcription. (b) The two-loop Neurospora model [18]. Two isoforms of FRQ are produced which both repress frq transcription. Light upregulates frq as in diagram (a). (c) The two-loop Arabidopsis model [35]. TOC1 activates its repressor LHY (combining LHY and CCA1) indirectly through a hypothetical gene X, forming the central negative feedback loop of the circuit. LHY is directly upregulated by light while light indirectly activates TOC1 via a second hypothetical gene Y, posited to have two distinct light inputs. Y activates TOC1 transcription and TOC1 represses Y, forming a second, interlocked feedback loop. (d) The three-loop Arabidopsis model [36]. The additional PRR gene (combining PRR7 and PRR9) is light-activated and represses LHY transcription. LHY upregulates PRR, creating a third feedback loop.
Figure 2.
Figure 2.
The abstract topologies for the logic representations of the clock circuits shown in figure 1. Genes are boxed and arrows denote regulatory interactions. (a) The single-loop Neurospora model. (b) The 2-loop Neurospora model. (c) The 2-loop Arabidopsis model. (d) The 3-loop Arabidopsis model. Numerals l index logic gates gl ∈ {0,1} that can be varied to generate different regulatory structures. Numerals at the end of an arrow index the single-input gate defining that interaction. Numerals within boxes index logic gates governing double-input interactions. Diamonds represent light inputs, with the corresponding fixed gates in ovals indicating how these affect the target species (e.g. in (c), L2 and L3 are combined with an OR gate after which the resulting bitstring is combined with the output of Y through an AND gate; see §4 for full details). τjs represent the circuit delays and Tis the discretization thresholds used to fit continuous data.
Figure 3.
Figure 3.
The number of parameters required for each clock configuration as DE models (white bars) and logic models (black bars).
Figure 4.
Figure 4.
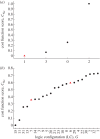
The results of exploring the logic configurations (LCs) belonging to the abstract topologies of the (a) 1-loop and (b) 2-loop Neurospora models. Cost scores are shown for the optimal fit of each LC to synthetic data. The LCs are indexed by their decimal representations for brevity (see §4 for details). Here, a score of 0 indicates the best fit and a score of 1 the worst fit. Triangles indicate LCs for which the Boolean model yields a viable clock. LCs mirroring the activation and inhibition pattern of the corresponding DE models in figure 1a,b are plotted in red. In (a), one such LC mirrors the corresponding DE model, G = (01), and this emerges as the optimal configuration yielding a viable clock. In (b), only LCs yielding scores less than 0.75 are shown. There are two that mirror the equivalent DE model. One of these, G = (00111), is identified as the optimal configuration giving a viable clock (leftmost red triangle). In this LC, either of the FRQ isoforms can independently inhibit transcription (the corresponding two-input gate is of the AND type).
Figure 5.
Figure 5.
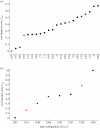
The results of exploring the logic configurations (LCs) belonging to the abstract topologies of the (a) 2-loop and (b) 3-loop Arabidopsis models. Cost scores are shown for the optimal fit of each LC to synthetic data. As in figure 4, each LC is indexed by its decimal expansion. Scores of 0 and 1 indicate the best and worst fits, respectively. Triangles denote LCs for which the Boolean model yields a viable clock. LCs mirroring the activation and inhibition pattern of the corresponding DE models in figure 1c,d are plotted in red. In (a), only LCs yielding scores less than 0.75 are shown. Of these, there are three LCs consistent with the activation and inhibition pattern of the equivalent DE model from a possible total of four. From this subset, G = (10011011) emerges as the optimal configuration yielding a viable clock. For this circuit, both LHY and TOC1 can independently inhibit Y, while TOC1 is repressed unless LHY is repressed while Y is activated (the corresponding gates are both of the AND type). In (b), only the eight LCs obtained by varying the gates of the PRR–LHY loop were considered: all other gates were fixed to those of the optimal 2-loop configuration. Of these eight possible circuits, two LCs were consistent with the equivalent DE model, from which G = (10011011011) is identified as the optimal configuration giving a viable clock. This LC corresponds to a clock network in which LHY is repressed unless PRR is inactive and X is active (the corresponding gate is of the AND type).
Figure 6.
Figure 6.
Time series for the differential equation and Boolean versions of the clock models in 12:12 LD cycles. Two 24-h cycles are plotted for each model. (a,b) 1-loop Neurospora; (c,d) 2-loop Neurospora; (e,f) 2-loop Arabidopsis; (g,h) 3-loop Arabidopsis. Differential equation time series (left panels) have been normalized to lie between 0 and 1 in order to facilitate comparison with the Boolean simulations (right panels). Different components within a model are slightly offset from one another so they can be distinguished more easily. The time step used for solving the Boolean models was 0.5 h, equal to the data sampling interval.
Figure 7.
Figure 7.
Comparing the photoperiodic behaviour of the Boolean and differential equation (DE) versions of each model. For Boolean models, the phase of each species is taken as the time within the LD cycle of the ON to OFF transition (downward triangles). Analogously, the DE model phases are defined as the times at which species decrease below the thresholds yielding the optimal fit of the corresponding Boolean circuit to data (upward triangles). Shaded areas of plots, darkness; open areas, light. (a) 1-loop Neurospora. The phase–photoperiod profiles are coincident, indicating that the Boolean model exactly reproduces the photoperiodic behaviour of its DE counterpart: FRQ transcript and protein are both locked to dusk across the photoperiod range. (b) 2-loop Neurospora. The phase plots are almost exactly equal, except for shorter photoperiods where they differ by the data sampling interval. As for (a), all components are locked to dusk. (c) 2-loop Arabidopsis. The Boolean and DE models exhibit very similar patterns of dawn- and dusk-locking across genes. The two Y phase–photoperiod profiles reflect the double peak observed in this component (figure 6e) which gives rise to a (dawn-locked) light-induced peak and a (dusk-locked) circadian peak [57]. (d) 3-loop Arabidopsis. The phase plots are similar, with all components predominately dawn-locked. As for 2-loop Arabidopsis, the two Y profiles reflect the double peak observed for this gene (figure 6g).
Figure 8.
Figure 8.
Identifying the logic configurations (LCs) of the 3-loop Arabidopsis model giving the best fits to experimental data. Plotting conventions are as described in figures 4 and 5. (a) Top-ranking LCs. The black arrow indicates the optimal configuration yielding a viable clock, GOPT = (10101011011). For this circuit, LHY and TOC1 repress each other, in agreement with recent biochemical evidence [51]. The red arrow denotes the second highest-ranking viable LC, GDE = (10011011011). This LC matches the regulatory structure of the DE model, and was previously identified as the configuration yielding the best fit to synthetic data (figure 5b). (b) Top-ranking LCs obtained under the constraint that LHY represses TOC1 and TOC1 activates LHY (i.e. g1 = 1 and g2 = g3 = 0; figure 2d). Under this assumption, GDE emerges as the optimal clock circuit. The circuit diagrams for GOPT and GDE can be seen in the electronic supplementary material, figure S4.
Figure 9.
Figure 9.
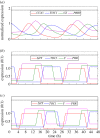
Simulations generated by the optimal fits of the 3-loop Arabidopsis model to experimental data. (a) Experimental expression profiles for the genes CCA1, TOC1, GI and PRR9 in free-running conditions (LL). Expression levels were determined using LUC reporter gene imaging constructs and have been normalized to lie between 0 and 1. (b) The equivalent Boolean time series generated by the logic configuration GOPT yielding the best fit to data. (c) Boolean expression profiles for the highest-ranked configuration GDE incorporating the central LHY–CCA1 negative feedback loop of the DE model. In all plots, different components are slightly offset from one another so they can be distinguished more easily. The time step used for solving the logic model was 1.5 h, equal to the data sampling interval.

References

    1. Dunlap J. C., Loros J. J., DeCoursey P. J. 2003. Chronobiology: biological timekeeping. Sunderland, MA: Sinauer Associates
    1. Young M. W., Kay S. A. 2001. Time zones: a comparative genetics of circadian clocks. Nat. Rev. Genet. 2, 702–71510.1038/35088576 (doi:10.1038/35088576) - DOI - DOI - PubMed
    1. Bell-Pedersen D., Cassone V. M., Earnest D. J., Golden S. S., Hardin P. E., Thomas T. L., Zoran M. 2005. Circadian rhythms from multiple oscillators: lessons from diverse organisms. Nat. Rev. Genet. 6, 544–55610.1038/nrg1633 (doi:10.1038/nrg1633) - DOI - DOI - PMC - PubMed
    1. Zhang E. E., Kay S. A. 2010. Clocks not winding down: unravelling circadian networks. Nat. Rev. Mol. Cell Biol. 11, 764–77610.1038/nrm2995 (doi:10.1038/nrm2995) - DOI - DOI - PubMed
    1. Khapre R. V., Samsa W. E., Kondatov R. V. 2010. Circadian regulation of cell cycle: molecular connections between aging and the circadian clock. Ann. Med. 42, 1695–170010.3109/07853890.2010.499134 (doi:10.3109/07853890.2010.499134) - DOI - DOI - PubMed

Publication types

MeSH terms

LinkOut - more resources