

Network- and attribute-based classifiers can prioritize genes and pathways for autism spectrum disorders and intellectual disability
- PMID: 22499558
- PMCID: PMC3505691
- DOI: 10.1002/ajmg.c.31330
Network- and attribute-based classifiers can prioritize genes and pathways for autism spectrum disorders and intellectual disability
Abstract
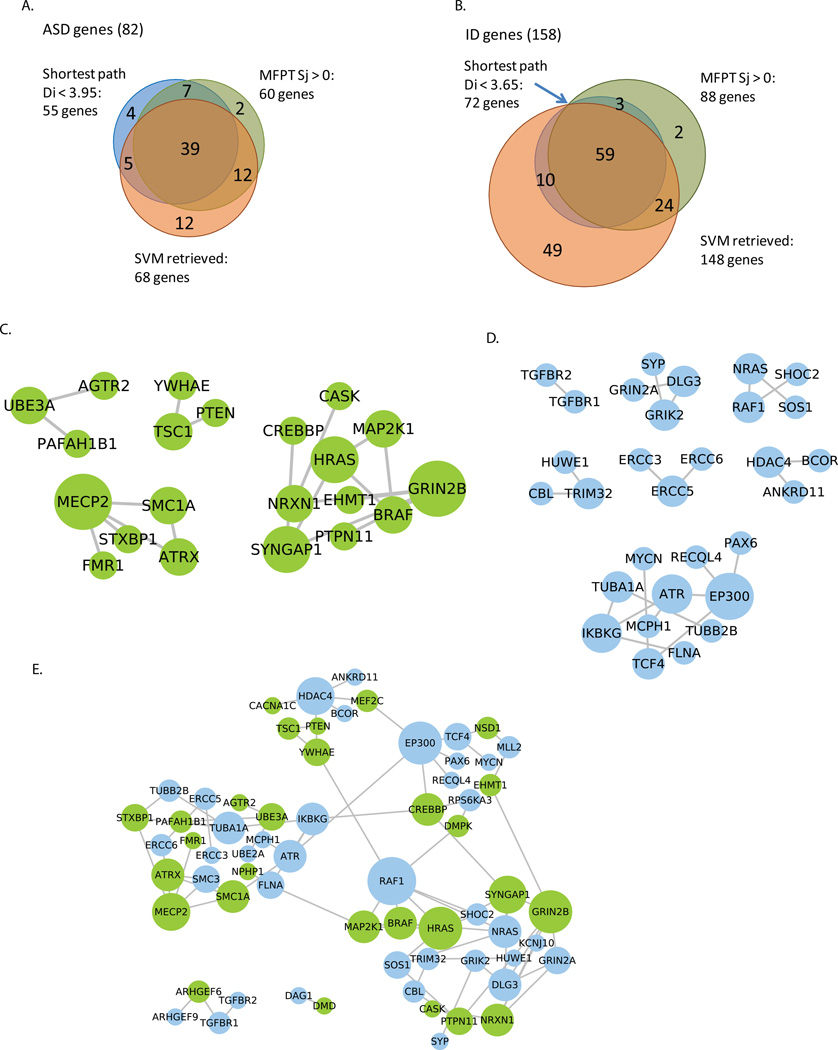
Autism spectrum disorders (ASD) are a group of related neurodevelopmental disorders with significant combined prevalence (∼1%) and high heritability. Dozens of individually rare genes and loci associated with high-risk for ASD have been identified, which overlap extensively with genes for intellectual disability (ID). However, studies indicate that there may be hundreds of genes that remain to be identified. The advent of inexpensive massively parallel nucleotide sequencing can reveal the genetic underpinnings of heritable complex diseases, including ASD and ID. However, whole exome sequencing (WES) and whole genome sequencing (WGS) provides an embarrassment of riches, where many candidate variants emerge. It has been argued that genetic variation for ASD and ID will cluster in genes involved in distinct pathways and protein complexes. For this reason, computational methods that prioritize candidate genes based on additional functional information such as protein-protein interactions or association with specific canonical or empirical pathways, or other attributes, can be useful. In this study we applied several supervised learning approaches to prioritize ASD or ID disease gene candidates based on curated lists of known ASD and ID disease genes. We implemented two network-based classifiers and one attribute-based classifier to show that we can rank and classify known, and predict new, genes for these neurodevelopmental disorders. We also show that ID and ASD share common pathways that perturb an overlapping synaptic regulatory subnetwork. We also show that features relating to neuronal phenotypes in mouse knockouts can help in classifying neurodevelopmental genes. Our methods can be applied broadly to other diseases helping in prioritizing newly identified genetic variation that emerge from disease gene discovery based on WES and WGS.
Copyright © 2012 Wiley Periodicals, Inc.
Figures
References
-
- Betancur C. Etiological heterogeneity in autism spectrum disorders: More than 100 genetic and genomic disorders and still counting. Brain Research. 2010;1380(0):42–77. - PubMed
-
- Beuming T, Skrabanek L, Niv MY, Mukherjee P, Weinstein H. PDZBase: a protein-protein interaction database for PDZ-domains. Bioinformatics. 2005;21(6):827–828. - PubMed
Publication types
MeSH terms
Substances
Grants and funding
- R01MH089025-02/MH/NIMH NIH HHS/United States
- P50 GM071558/GM/NIGMS NIH HHS/United States
- R01 AG014996/AG/NIA NIH HHS/United States
- RC2LM010994-01/LM/NLM NIH HHS/United States
- M01 RR000071/RR/NCRR NIH HHS/United States
- R01 AG021792/AG/NIA NIH HHS/United States
- R01 MH089025/MH/NIMH NIH HHS/United States
- RC2 LM010994/LM/NLM NIH HHS/United States
- P01 AG002219/AG/NIA NIH HHS/United States
- AS6693/Autism Speaks/United States
- R01DK088541-01A1/DK/NIDDK NIH HHS/United States
- P50GM071558-03/GM/NIGMS NIH HHS/United States
- P50 MH066392/MH/NIMH NIH HHS/United States
- U54 MH066673/MH/NIMH NIH HHS/United States
- R01 AG015801/AG/NIA NIH HHS/United States
- R01 DK088541/DK/NIDDK NIH HHS/United States
- AS7457/Autism Speaks/United States
- R56 MH097849/MH/NIMH NIH HHS/United States
- R01 GM098316/GM/NIGMS NIH HHS/United States
- P01 AG010491/AG/NIA NIH HHS/United States
- R01 MH093725/MH/NIMH NIH HHS/United States
- P50 AG005138/AG/NIA NIH HHS/United States
