. 2012 May 1;109(18):7049-54.
doi: 10.1073/pnas.1114513109. Epub 2012 Apr 12.

Expression-based genome-wide association study links the receptor CD44 in adipose tissue with type 2 diabetes

Affiliations

Expression-based genome-wide association study links the receptor CD44 in adipose tissue with type 2 diabetes

Keiichi Kodama et al. Proc Natl Acad Sci U S A. .

Abstract

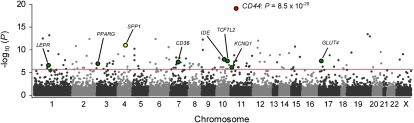
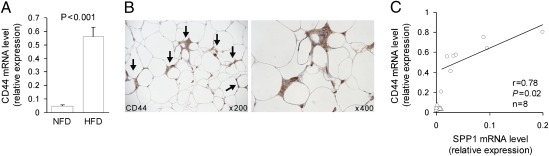
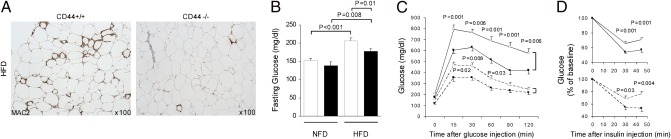
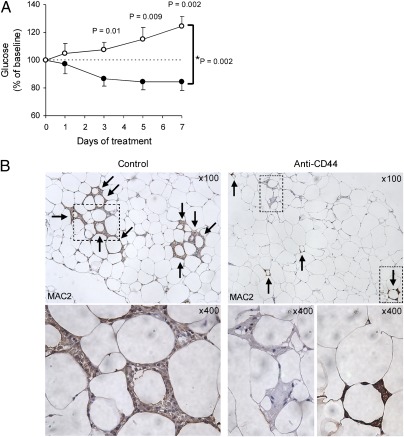
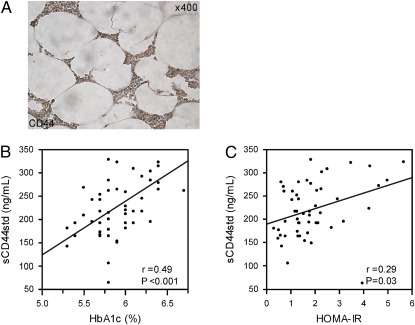
Type 2 diabetes (T2D) is a complex, polygenic disease affecting nearly 300 million people worldwide. T2D is primarily characterized by insulin resistance, and growing evidence has indicated the causative link between adipose tissue inflammation and the development of insulin resistance. Genetic association studies have successfully revealed a number of important genes consistently associated with T2D to date. However, these robust T2D-associated genes do not fully elucidate the mechanisms underlying the development and progression of the disease. Here, we report an alternative approach, gene expression-based genome-wide association study (eGWAS): searching for genes repeatedly implicated in functional microarray experiments (often publicly available). We performed an eGWAS across 130 independent experiments (totally 1,175 T2D case-control microarrays) to find additional genes implicated in the molecular pathogenesis of T2D and identified the immune-cell receptor CD44 as our top candidate (P = 8.5 × 10(-20)). We found CD44 deficiency in a diabetic mouse model ameliorates insulin resistance and adipose tissue inflammation and also found that anti-CD44 antibody treatment decreases blood glucose levels and adipose tissue macrophage accumulation in a high-fat, diet-fed mouse model. Further, in humans, we observed CD44 is expressed in inflammatory cells in obese adipose tissue and discovered serum CD44 levels were positively correlated with insulin resistance and glycemic control. CD44 likely plays a causative role in the development of adipose tissue inflammation and insulin resistance in rodents and humans. Genes repeatedly implicated in publicly available experimental data may have unique functionally important roles in T2D and other complex diseases.


Conflict of interest statement

The authors declare no conflict of interest.

Figures

Fig. 1.
Fig. 1.
eGWAS for T2D using a χ2 analysis. Plot of -log10 (P value) (y axis) by chromosomal position (x axis). P values for each gene were calculated from our eGWAS across 130 microarray experiments with 1,175 T2D case-control microarray samples (591 T2D cases and 584 controls) as the likelihood of finding repeated differential expression compared with expected using a χ2 analysis, or a Fisher’s exact test (Fig. S3). Our top gene, CD44, showed a significant differential expression in 78 experiments (P = 8.5 × 10⁻²⁰). The red line indicates the Bonferroni threshold (P = 2.0 × 10⁻⁶). The green dots indicate several well known T2D-susceptibility genes.
Fig. 2.
Fig. 2.
CD44 expression in adipose tissue of obese mice. (A) CD44 mRNA expression levels in epididymal adipose tissues in C57BL/6J mice fed either a NFD or HFD (n = 8 per group). (B) CD44 immunoreactivity (arrows, DAB chromogen; brown) in epididymal adipose tissues from C57BL/6J mice fed a HFD. Sections were counterstained with hematoxylin (blue). (C) CD44 and SPP1 gene expression profiles in the HFD (n = 8; circles) and NFD (n = 8; triangles) groups. Correlation between CD44 and SPP1 mRNA expression in the HFD group (circles) was analyzed by using the Pearson’s correlation test. Gene expression was monitored by using real-time RT-PCR and normalized to expression of GAPDH mRNA.
Fig. 3.
Fig. 3.
Histological and metabolic analyses of wild-type CD44+/+ and CD44−/− mice. (A) Inflammatory cell (macrophage) content determined by immunohistochemical staining for Mac-2 (DAB, brown; hematoxylin, blue) in epididymal adipose tissues from CD44−/− and CD44+/+ mice fed a HFD. (BD) Metabolic measurements on CD44+/+ (open bars and symbols; diabetes-prone) and CD44−/− (filled bars and symbols) mice fed either a HFD (n = 16 per group; solid lines) or a NFD (n = 10 per group; dashed lines). (B) Fasting blood glucose. (C) Glucose tolerance tests [i.p. glucose (2 g/kg body weight)] after a 14-h overnight fast. Venous blood was obtained for measurement of blood glucose at 0, 15, 30, 60, 90, and 120 min after the injection. (D) Insulin tolerance tests [i.p. insulin (1.0 unit/kg body weight)] after a 4-h fast. Venous blood was obtained for measurement of blood glucose at 0, 30, and 45 min after the injection.
Fig. 4.
Fig. 4.
Anti-CD44 antibody treatment for diabetic mice. (A) HFD-fed C57BL/6J mice were injected intraperitoneally with purified rat anti-mouse CD44 (IM7; 553131, BD Pharmingen) (n = 6; filled circles) or purified rat IgG2b, κ isotype control (A95-1; 559478, BD Pharmingen) (n = 8; open circles) for 1 wk (100 μg at day 0 and 50 μg at day 1–7). Morning blood glucose was measured at day 0, 1, 3, 5, and 7 during the treatment. The effect of anti-CD44 treatment on blood glucose levels was evaluated with two-way repeated measures ANOVA (*P; treatment × time). Comparisons between two groups were performed by using the two-tailed Welch's t test. Data are represented as mean ± SE. (B) Epididymal adipose tissues from control and anti-CD44 antibody-treated mice were analyzed for inflammatory cell (macrophage) content by using a Mac-2 antibody (magnified as indicated). Arrows indicate crown-like structures (CLSs) surrounding individual adipocytes.
Fig. 5.
Fig. 5.
CD44 functional experiments in human subjects. (A) Paraffin-embedded omental adipose tissue from an obese woman [age (yr); 57, BMI (kg/m2); 36.9] was analyzed for CD44 immunoreactivity. (B and C) The correlation between serum levels of standard soluble CD44 (sCD44std) and either an index of glycemic control, HbA1c (B), or an index of insulin resistance, HOMA-IR (C), determined by using a linear regression model estimated with minimal square method in human subjects [n = 55: mean ± SD age (yr), 60.3 ± 15; BMI (kg/m2), 23.2 ± 4.3; fasting plasma glucose (mg/dL), 109 ± 13; fasting plasma insulin (μU/mL), 6.22 ± 3.84; HbA1c (%), 5.9 ± 0.34].

References

    1. Hotamisligil GS. Inflammation and metabolic disorders. Nature. 2006;444:860–867. - PubMed
    1. Shoelson SE, Lee J, Goldfine AB. Inflammation and insulin resistance. J Clin Invest. 2006;116:1793–1801. - PMC - PubMed
    1. Wellcome Trust Case Control Consortium Genome-wide association study of 14,000 cases of seven common diseases and 3,000 shared controls. Nature. 2007;447:661–678. - PMC - PubMed
    1. Scott LJ, et al. A genome-wide association study of type 2 diabetes in Finns detects multiple susceptibility variants. Science. 2007;316:1341–1345. - PMC - PubMed
    1. Saxena R, et al. Diabetes Genetics Initiative of Broad Institute of Harvard and MIT, Lund University, and Novartis Institutes of BioMedical Research Genome-wide association analysis identifies loci for type 2 diabetes and triglyceride levels. Science. 2007;316:1331–1336. - PubMed

Publication types

MeSH terms