Review
. 2012 Apr 13;336(6078):183-7.
doi: 10.1126/science.1216379.

Using gene expression noise to understand gene regulation

Affiliations
Review

Using gene expression noise to understand gene regulation

Brian Munsky et al. Science. .

Abstract

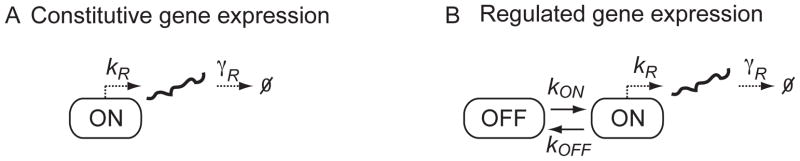
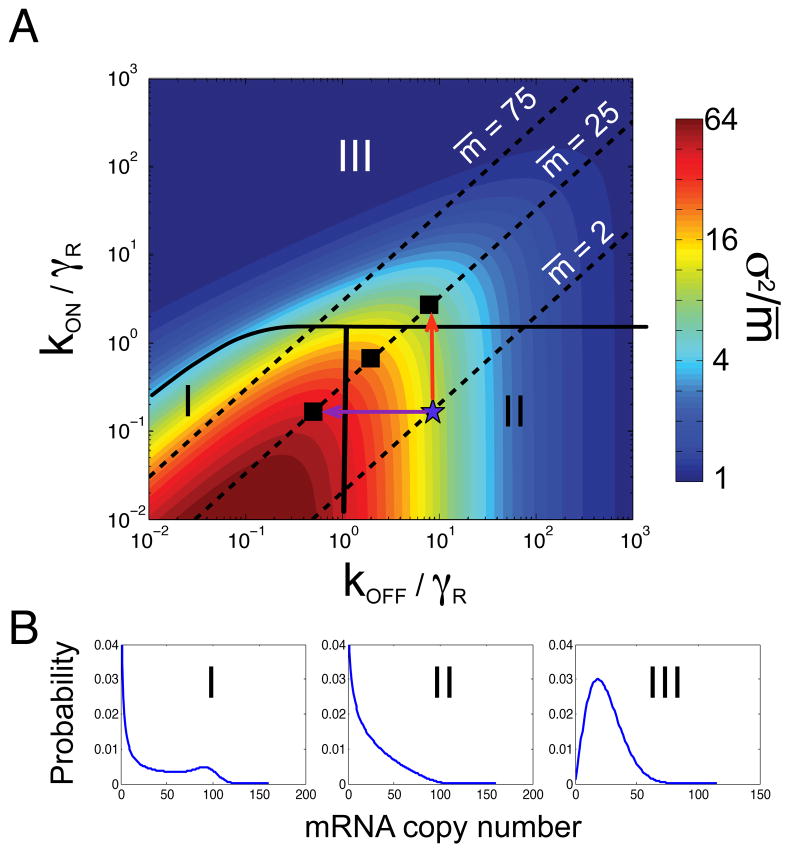
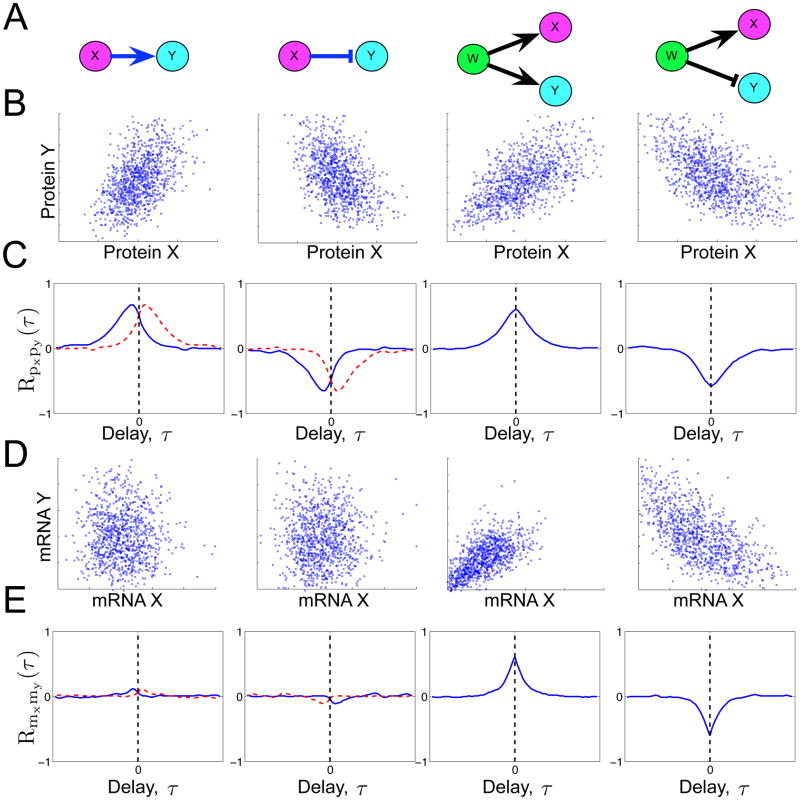
Phenotypic variation is ubiquitous in biology and is often traceable to underlying genetic and environmental variation. However, even genetically identical cells in identical environments display variable phenotypes. Stochastic gene expression, or gene expression "noise," has been suggested as a major source of this variability, and its physiological consequences have been topics of intense research for the last decade. Several recent studies have measured variability in protein and messenger RNA levels, and they have discovered strong connections between noise and gene regulation mechanisms. When integrated with discrete stochastic models, measurements of cell-to-cell variability provide a sensitive "fingerprint" with which to explore fundamental questions of gene regulation. In this review, we highlight several studies that used gene expression variability to develop a quantitative understanding of the mechanisms and dynamics of gene regulation.


Figures

Fig. 1
Fig. 1. Constitutive versus regulated gene expression
A) Schematic of a constitutive gene expression model with transcription rate kR and mRNA degradation rate constant γR. B) Schematic of a two-state (ON, OFF) model with transition rates kON and kOFF.
Fig. 2
Fig. 2. Effects of transcriptional control on mRNA distributions
A) Heat map of the cell-to-cell variability (Fano factor, σ2/), versus normalized gene activation rate kONR and normalized deactivation rate kOFFR with fixed production and degradation rates (kR = 100, γR = 1). Lines of equal average mRNA expression are shown for 2, 25, and 75 molecules. The parameter space is separated into three classes (I,II,III) that exhibit different types of cell-to-cell variability. B) Representative distributions from each class: Class I corresponds to systems with long OFF and ON periods, giving rise to bimodal distributions with clearly delineated ON/OFF populations. Class II corresponds to populations with short ON and long OFF periods, giving rise to occasional mRNA bursts and long distribution tails. Class III includes systems with short OFF periods, giving rise to continuous production and more graded unimodal distributions. All three distributions have the same average of 25 mRNA and correspond to the squares in (A). Distributions were computed using the Finite State Projection approach (34).
Fig. 3
Fig. 3. Different regulatory motifs yield different steady-state correlations
A) Schematics of four possible regulator motifs: X activates Y; X represses Y; W activates both X and Y; and W activates X but represses Y. For each motif, mRNA is produced according the constitutive model; protein is translated from mRNA as a first order reaction; and both mRNA and protein degrade as a first order reaction. Regulation changes to the transcription rate are defined kR(X) = αX4/(M4 + X4) for activation kR(X) = αM4/(M4 + X4) for repression. B) Scatter plots of the populations of protein X and protein Y at steady state. C) Dynamic cross-correlation functions of protein X and protein Y, versus the correlation time delay. The magnitude of RXY (τ) indicates how strongly X(t+τ) is correlated (positive) or anti-correlated (negative) with Y(t). For causal events, where X activates (or represses) Y, peaks (or dips) appear in RXY (τ) at negative values of τ. Blue lines correspond to the motif in (A), and red lines correspond to the same motif in which X and Y have been interchanged. D) Scatter plots for mRNA X and mRNA Y populations. E) Dynamic cross-correlation for mRNA X and mRNA Y. Simulations were conducted using the stochastic simulation algorithm (35).

References

    1. Li GW, Xie XS. Nature. 2011;475:308. - PMC - PubMed
    1. Raj A, van Oudenaarden A. Cell. 2008;135:216. - PMC - PubMed
    1. Balázsi G, van Oudenaarden A, Collins JJ. Cell. 2011;144:910. - PMC - PubMed
    1. Eldar A, Elowitz MB. Nat Cell Biol. 2010;467:167. - PubMed
    1. Lidstrom ME, Konopka MC. Nat Chem Biol. 2010;6:705. - PubMed

Publication types