. 2012 Jun 8;287(24):20755-68.
doi: 10.1074/jbc.M112.340919. Epub 2012 Apr 12.

Lecithin:cholesterol acyltransferase deficiency protects against cholesterol-induced hepatic endoplasmic reticulum stress in mice

Affiliations

Lecithin:cholesterol acyltransferase deficiency protects against cholesterol-induced hepatic endoplasmic reticulum stress in mice

Lauren Hager et al. J Biol Chem. .

Abstract

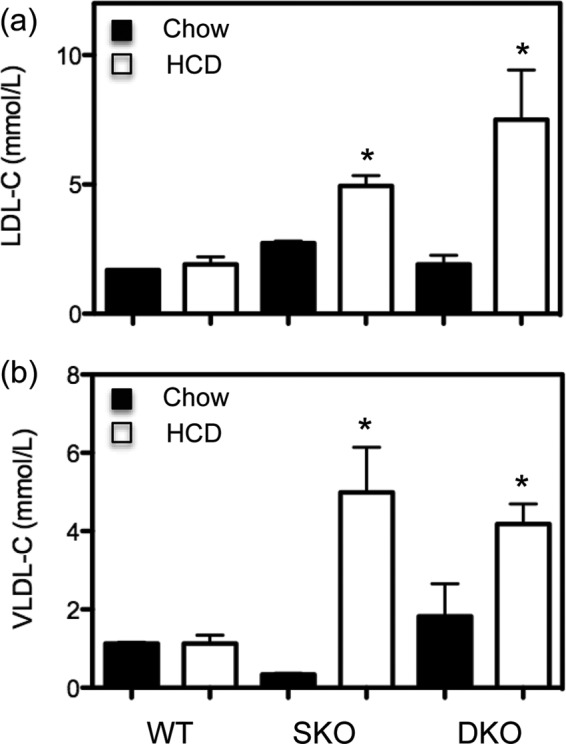
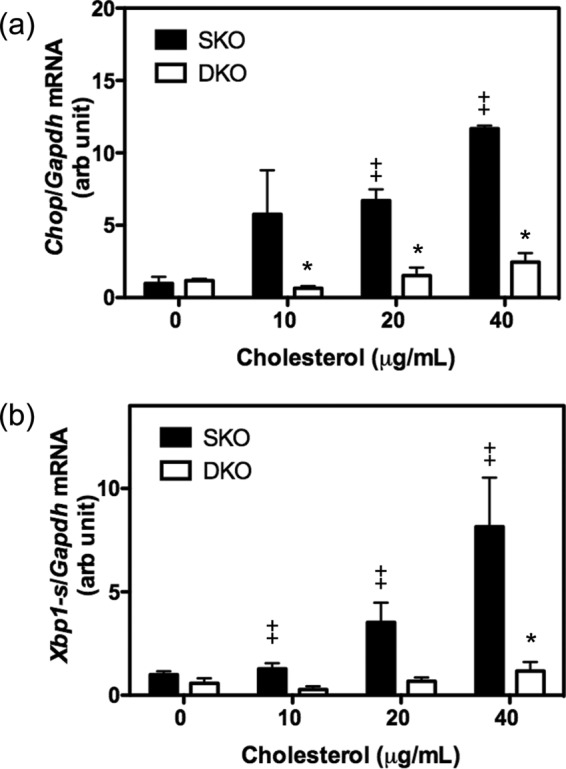
We recently reported that lecithin:cholesterol acyltransferase (LCAT) knock-out mice, particularly in the LDL receptor knock-out background, are hypersensitive to insulin and resistant to high fat diet-induced insulin resistance (IR) and obesity. We demonstrated that chow-fed Ldlr-/-xLcat+/+ mice have elevated hepatic endoplasmic reticulum (ER) stress, which promotes IR, compared with wild-type controls, and this effect is normalized in Ldlr-/-xLcat-/- mice. In the present study, we tested the hypothesis that hepatic ER cholesterol metabolism differentially regulates ER stress using these models. We observed that the Ldlr-/-xLcat+/+ mice accumulate excess hepatic total and ER cholesterol primarily attributed to increased reuptake of biliary cholesterol as we observed reduced biliary cholesterol in conjunction with decreased hepatic Abcg5/g8 mRNA, increased Npc1l1 mRNA, and decreased Hmgr mRNA and nuclear SREBP2 protein. Intestinal NPC1L1 protein was induced. Expression of these genes was reversed in the Ldlr-/-xLcat-/- mice, accounting for the normalization of total and ER cholesterol and ER stress. Upon feeding a 2% high cholesterol diet (HCD), Ldlr-/-xLcat-/- mice accumulated a similar amount of total hepatic cholesterol compared with the Ldlr-/-xLcat+/+ mice, but the hepatic ER cholesterol levels remained low in conjunction with being protected from HCD-induced ER stress and IR. Hepatic ER stress correlates strongly with hepatic ER free cholesterol but poorly with hepatic tissue free cholesterol. The unexpectedly low ER cholesterol seen in HCD-fed Ldlr-/-xLcat-/- mice was attributable to a coordinated marked up-regulation of ACAT2 and suppressed SREBP2 processing. Thus, factors influencing the accumulation of ER cholesterol may be important for the development of hepatic insulin resistance.


Figures

FIGURE 1.
FIGURE 1.
a–c, hepatic lipid analyses on 9-week-old female WT (n = 4), Ldlr−/−xLcat+/+ (SKO) (n = 5), and Ldlr−/−xLcat−/− (DKO) (n = 5) mice fed either a chow (filled bars) or a 2% HCD (open bars) for 10 weeks. Data are means ± S.D. (error bars). a, total cholesterol; b, free cholesterol; and c, triglyceride. *, p < 0.05 for SKO versus WT; **, p < 0.05 for DKO versus SKO on the same diet; #, p < 0.05 for HCD versus chow by one-way ANOVA and Tukey post test. d and e, protective effect of LCAT deficiency in cholesterol diet-induced ER stress. 9-week-old female SKO and DKO mice (n > 4) were fed either a chow diet or 2% HCD for 10 weeks, and hepatic tissue mRNA was measured for Chop (c) and Xbp1-s (d). *, p < 0.05 for SKO versus WT; **, p < 0.05 for DKO versus SKO on the same diet; #, p < 0.05 for HCD versus chow by one-way ANOVA and Tukey post test. arb, arbitrary.
FIGURE 2.
FIGURE 2.
a–c, hepatic UPR expression in response to a high cholesterol diet. 20-week-old female SKO and DKO mice were fed either chow or 2% HCD (n = 4 for each group) for 4 weeks. Effects of HCD feeding were determined on hepatic tissue UPR markers Chop mRNA (a), Xbp1-s mRNA (b), and phospho-EIF2α (P-eif2α) protein (c) levels. Data are means ± S.D. (error bars). *, p < 0.05 for HCD-fed mice versus their respective chow-fed controls by unpaired t test with Welch's correction. d and e, glucose tolerance test in female SKO and DKO mice after 10 weeks of a 2% HCD. d, mean glucose excursions in response to an intraperitoneal glucose challenge. e, mean area under the glucose excursion curve (AUC). *, p < 0.05 against their respective genotype control (SKO); #, p < 0.05 compared with diet control (chow) by one-way ANOVA and Tukey post test. arb, arbitrary.
FIGURE 3.
FIGURE 3.
Lipoprotein analyses in SKO and DKO mice fed either chow or 2% HCD for 10 weeks. Cholesterol (C) was measured in FPLC fractions of the plasma samples and pooled into LDL (a) and VLDL (b) fractions for analyses. Data are means ± S.D. (error bars). *, p < 0.05 compared with their respective diet (chow) controls by one-way ANOVA and Tukey post test.
FIGURE 4.
FIGURE 4.
Cholesterol induction of ER stress in primary hepatocytes from 9–11-week-old female SKO and DKO mice. Primary hepatocytes were treated with cholesterol-MCD complex for 16 h at 0, 10, 20, and 40 μg/ml; RNA was isolated; and mRNA expression levels of Chop (a) and Xbp1-s (b) were quantified by quantitative real time PCR. Data are means ± S.D. (error bars). *, p < 0.05 for comparison with genotype (SKO) for each concentration; ‡, p < 0.05 for comparison with untreated (0 μg/ml) controls by two-way ANOVA. n > 4 for all samples. arb, arbitrary.
FIGURE 5.
FIGURE 5.
a–c, induction of hepatic ER cholesterol in the SKO mice and resistance to induction in the DKO mice. a, 9-week-old female mice were fed either a chow diet or 2% HCD for 10 weeks. ER membrane fractions were isolated from liver tissues after an overnight fast. FC was measured by LC/MS/MS, and PL levels were obtained by colorimetric assay. Data are means ± S.D. (error bars). *, p < 0.05 compared with their respective WT controls; ‡, p < 0.05 compared with their respective SKO controls; #, p < 0.05 compared with diet control (chow diet) (n > 3) by one-way ANOVA and Tukey post test. The correlation of ER stress marker Chop mRNA levels with ER FC (Chol)/PL (b) and hepatic tissue free cholesterol (c) in WT, SKO and DKO mice on chow and 2% HCD is shown. The solid line indicates the curve of best fit using an exponential non-linear regression analysis. d and e, hepatic expression of HSP60 protein in age-matched female WT, SKO, and DKO mice fed with either chow (d) or 4 weeks of 2% HCD (e). One-way ANOVA with Tukey post test revealed no difference between any pair of data within the group. arb, arbitrary.
FIGURE 6.
FIGURE 6.
Effect of ZA and HPCD on ER free cholesterol (chol) (a) and hepatic Chop (b) and Xbp1-s mRNA (c) in primary hepatocytes from chow-fed female Ldlr−/−xLcat+/+ mice. Data are means ± S.D. (error bars). *, p < 0.05 when compared with untreated control cells (n > 4) by one-way ANOVA and Tukey post test. Results in b were confirmed by repeat one-way ANOVA and Tukey post test after square root transformation. arb, arbitrary.
FIGURE 7.
FIGURE 7.
a, hepatic levels of markers of cholesterol homeostatic machinery in livers of chow- and HCD-fed WT, SKO, and DKO mice. 9-week-old female mice were fed either chow or a 2% HCD for 10 weeks, and hepatic tissues were harvested after an overnight fast. a, nuclear protein abundance of nSREBP2 by Western blot (n = 3–6). b and c, Hmgr mRNA levels (n = 4 each). d, Insig1 mRNA levels (n = 4 each). e and f, INSIG1 protein levels (n = 4–7). TRC8 protein levels in chow-fed mice (n = 7–8) (g) and HCD-fed mice (n = 3 each) (h) are shown. Data are means ± S.D. (error bars). *, p < 0.05 compared with their respective genotype WT controls; #, p < 0.05 compared with SKO control by one-way ANOVA and Tukey post test. arb, arbitrary.
FIGURE 8.
FIGURE 8.
Biliary cholesterol levels and expression of hepatic and intestinal cholesterol transporters in chow-fed WT, Ldlr−/−xLcat+/+ (SKO), and Ldlr−/−xLcat−/− (DKO) mice. a, biliary cholesterol (Chol) concentrations (n = 4–5). Shown are mRNA expressions of hepatic Abcg5 (n = 8 each) (b) and Abcg8 (n = 4 each) (c), intestinal NPC1L1 protein (n = 6 each) (d), hepatic Npc1l1 mRNA (n = 4 each) (e), protein levels of hepatic NPC1L1 (n = 5–7) (f) and hepatic NPC2 (n = 4 each) (g), hepatic Abcb4 mRNA (n = 3 each) (h), and protein levels of hepatic ABCA1 (n = 6 each) (i) and SRBI (n = 3 each) (j). Data are means ± S.D. (error bars). *, p < 0.05 compared with their respective genotype WT controls; #, p < 0.05 compared with SKO control by one-way ANOVA and Tukey post test. Results in a and d were confirmed by Kruskal-Wallis test followed by Dunn's multiple comparisons, and results in b were confirmed by unpaired t tests with Welch's correction. arb, arbitrary; Sml, small.
FIGURE 9.
FIGURE 9.
a, expression of ACAT2 in WT, SKO, and DKO mice. Hepatic tissue protein levels of ACAT2 for both chow- and 2% HCD-fed, age-matched mice by two-way ANOVA. Data are means ± S.D. (error bars). *, p < 0.05 when compared with their respective chow fed controls. #, p < 0.05 when compared with HCD-fed WT control. b, effect of ACAT2 inhibition on ER cholesterol and ER stress. Primary hepatocytes from HCD-fed DKO mice were pretreated with cholesterol-MCD for 16 h followed by treatment with PPPA (Chol + PPPA), a specific ACAT2 inhibitor, for 30 min or with methanol (Chol) as control. Effects of PPPA treatment on ER free cholesterol and Chop mRNA and Xbp1-s mRNA levels versus their respective untreated controls by unpaired t tests with Welch's correction are shown. *, p < 0.05.

References

    1. Rousset X., Vaisman B., Amar M., Sethi A. A., Remaley A. T. (2009) Lecithin:cholesterol acyltransferase—from biochemistry to role in cardiovascular disease. Curr. Opin. Endocrinol. Diabetes Obes. 16, 163–171 - PMC - PubMed
    1. Ng D. S., Xie C., Maguire G. F., Zhu X., Ugwu F., Lam E., Connelly P. W. (2004) Hypertriglyceridemia in lecithin-cholesterol acyltransferase-deficient mice is associated with hepatic overproduction of triglycerides, increased lipogenesis, and improved glucose tolerance. J. Biol. Chem. 279, 7636–7642 - PubMed
    1. Lambert G., Sakai N., Vaisman B. L., Neufeld E. B., Marteyn B., Chan C. C., Paigen B., Lupia E., Thomas A., Striker L. J., Blanchette-Mackie J., Csako G., Brady J. N., Costello R., Striker G. E., Remaley A. T., Brewer H. B., Jr., Santamarina-Fojo S. (2001) Analysis of glomerulosclerosis and atherosclerosis in lecithin cholesterol acyltransferase-deficient mice. J. Biol. Chem. 276, 15090–15098 - PubMed
    1. Ng D. S., Maguire G. F., Wylie J., Ravandi A., Xuan W., Ahmed Z., Eskandarian M., Kuksis A., Connelly P. W. (2002) Oxidative stress is markedly elevated in lecithin:cholesterol acyltransferase-deficient mice and is paradoxically reversed in the apolipoprotein E knockout background in association with a reduction in atherosclerosis. J. Biol. Chem. 277, 11715–11720 - PubMed
    1. Song H., Zhu L., Picardo C. M., Maguire G., Leung V., Connelly P. W., Ng D. S. (2006) Coordinated alteration of hepatic gene expression in fatty acid and triglyceride synthesis in LCAT-null mice is associated with altered PUFA metabolism. Am. J. Physiol. Endocrinol. Metab. 290, E17–E25 - PubMed

Publication types

MeSH terms

Substances