

doi: 10.1016/j.neuron.2012.03.016.
Not noisy, just wrong: the role of suboptimal inference in behavioral variability
Affiliations
- PMID: 22500627
- PMCID: PMC4486264
- DOI: 10.1016/j.neuron.2012.03.016
Item in Clipboard
Not noisy, just wrong: the role of suboptimal inference in behavioral variability
Neuron.
.
Abstract
Behavior varies from trial to trial even when the stimulus is maintained as constant as possible. In many models, this variability is attributed to noise in the brain. Here, we propose that there is another major source of variability: suboptimal inference. Importantly, we argue that in most tasks of interest, and particularly complex ones, suboptimal inference is likely to be the dominant component of behavioral variability. This perspective explains a variety of intriguing observations, including why variability appears to be larger on the sensory than on the motor side, and why our sensors are sometimes surprisingly unreliable.
Copyright © 2012 Elsevier Inc. All rights reserved.
Figures
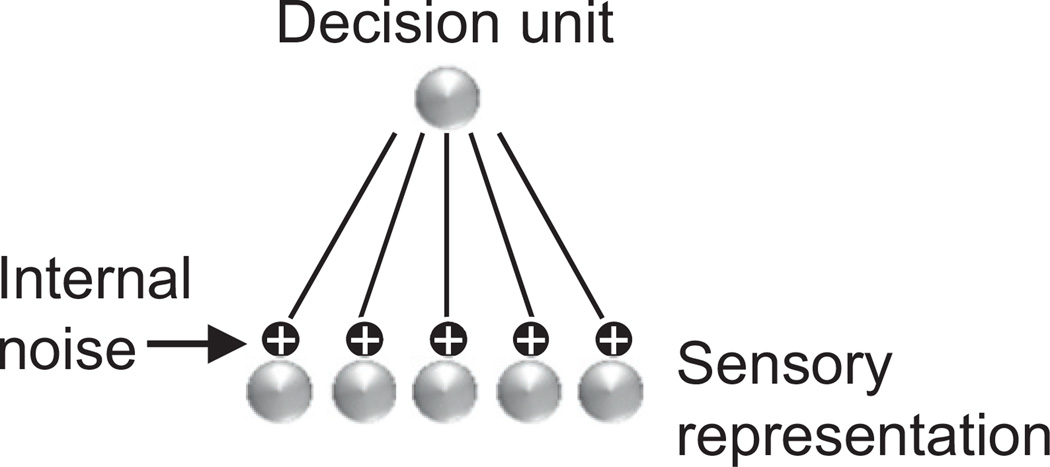
The input neurons encode the sensory stimulus and projectto a single decision unit. Internal noise is injected in the response of the input units, often in the form of independent Poisson variability.
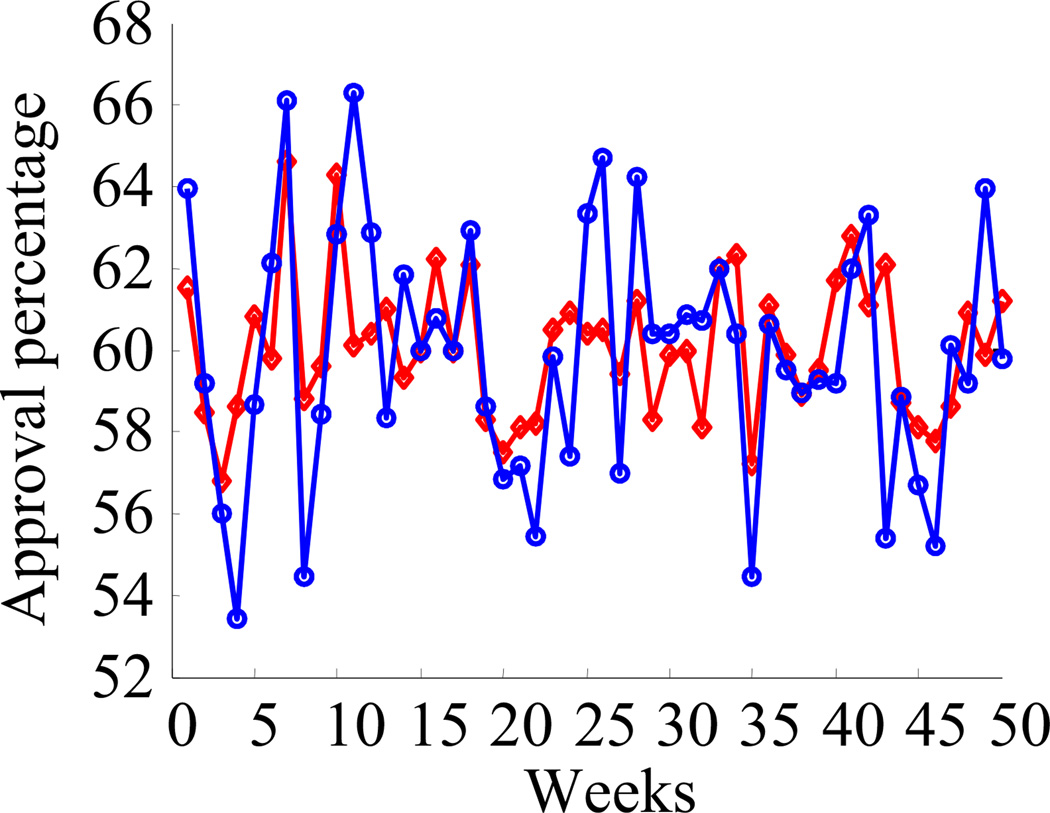
The plot shows the fluctuations in estimated approval ratings using two different methods. In popt (red), the estimate from the two different companies are combined optimally, while in pav (blue), they are combined suboptimally. Note that the variability in pav is greater than the variability in popt. This additional variability in pav is not due to noise; it is due to suboptimal inference caused by a deterministic approximation of the assumed statistical structure of the data.
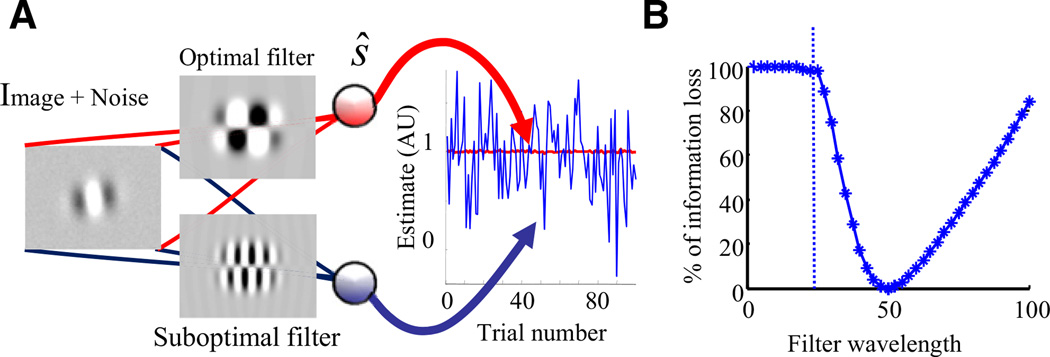
(A) The image consists of a Gabor patch oriented at either +5° or −5°, plus small additive noise on each pixel. Both units compute the dot product of the image with a linear filter (their feedforward weights) to yield a decision of which stimulus is present. The top unit uses the filter that discriminates optimally between these two particular oriented stimuli. In contrast, the bottom unit uses a filter that is optimized for a Gabor patch with twice the frequency of the patch in the image. The plot on the right shows the activity of the two units for 100 presentations of the Gabor patches, all oriented at +5° but with different pixel noise. The filters have been normalized to ensure that the mean response is 1 in both cases. The standard deviation of the bottom unit (blue) is 54 times larger than the standard deviation of the top unit (red; although the trace looks flat, it does in fact fluctuate). In other words, more than 98% of the variability of the bottom unit is due to the use of a suboptimal filter. (B) Percentage of Fisher information loss as a function of the wavelength of the filter. The information loss increases steeply as soon as the wavelength of the filter differs from the wavelength in the image (set to 50).
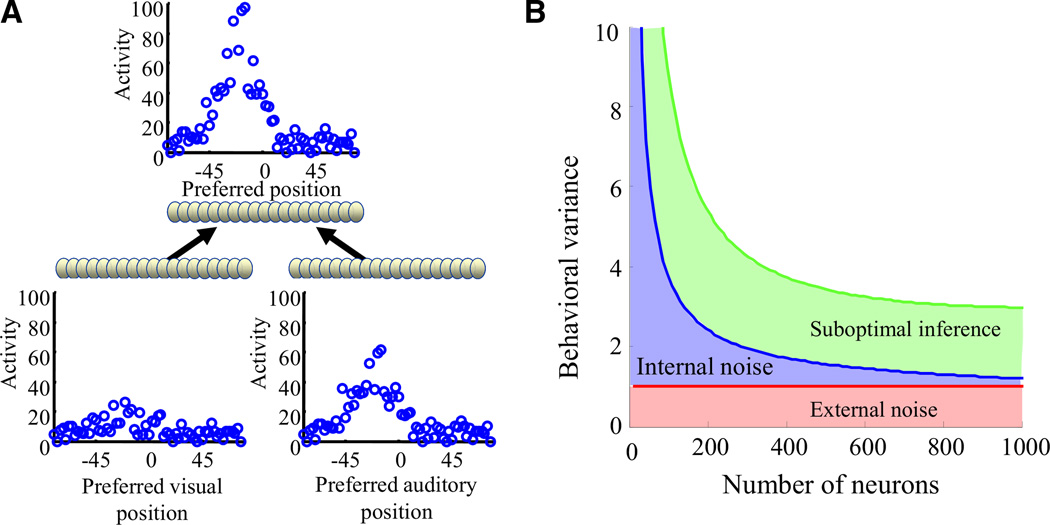
(A) Network architecture. Two inputs layers encode the position of an object based on visual and auditory information, using population codes. Typical patterns of activity on a given trial are shown above each layer. These input neurons project onto an output layer representing the position of the object based on both the visual and auditory information. (B) Behavioral variance of the network (modeled as the variance of the maximum likelihood estimate of position based on the output layer activity) as a function of the number of neurons in the output layer. Red line: lower bound on the variance given the information available in the input layer (based on the Cramer-Rao bound). Blue curve: network with optimal connectivity. The increase in variance (compared to the red curve) is due to internal noise in the form of stochastic spike generation in the output layer. The blue curve eventually converges to the red curve, indicating that the impact of internal noise is negligible for large networks (the noise is simply averaged out). Green curve: network with suboptimal connectivity. In a suboptimal network, the information loss can be very large. Importantly, this loss cannot be reduced by adding more neurons; that is, no matter how large the network, performance will still be well above the minimum variance set by the Cramer-Rao bound (red line). As a result, for large networks, the information loss is due primarily to suboptimal inference and not to internal noise.
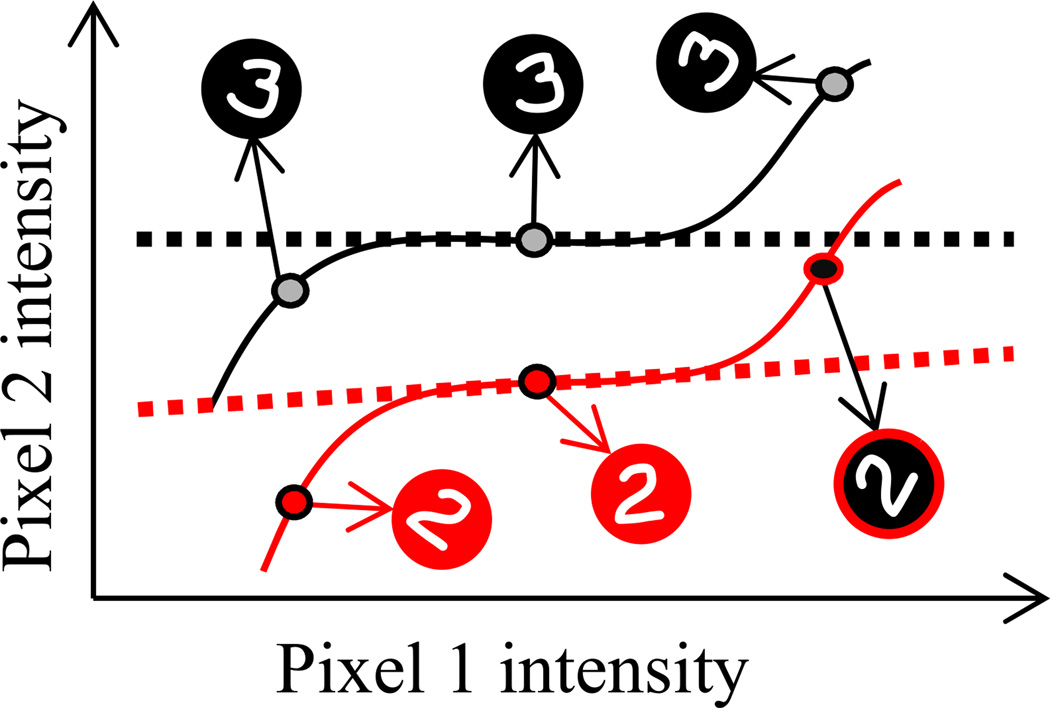
Handwritten digit recognition can be formalized as a problem of modeling manifolds in n-dimensional space, where n is the number of pixels in the image. Each point in this space corresponds to one particular image (only two dimensions are shown for clarity). We show here a schematic representation of the manifolds corresponding to rotated 2s (red solid line) and 3s (black solid line). Modeling these manifolds is typically hard and requires approximations. One common approach involves using a locally linear approximation, shown here as dashed lines. This approximation would result in misclassifying the image of the 2 shown with a black background as a 3, as it lies closer to the linear approximation of the manifold corresponding to 3. This illustrates how suboptimal inference can affect behavioral performance even when the inputs are unaffected by internal noise.
References
-
- Banerjee A, Serie`s P, Pouget A. Dynamical constraints on using precise spike timing to compute in recurrent cortical networks. Neural Comput. 2008;20:974–993. - PubMed
-
- Barlow HB. Retinal noise and absolute threshold. J. Opt. Soc. Am. 1956;46:634–639. - PubMed
-
- Bialek W, DeWeese M. Random switching and optimal processing in the perception of ambiguous signals. Phys. Rev. Lett. 1995;74:3077–3080. - PubMed
-
- Cahan D. Science and culture: popular and philosophical essays -Hermann von Helmholtz. Chicago: The University of Chicago Press; 1995.
Publication types
MeSH terms
Grants and funding
LinkOut - more resources
Full Text Sources
