. 2012 Mar;17(3):036003.
doi: 10.1117/1.JBO.17.3.036003.

Wide-field spectral imaging of human ovary autofluorescence and oncologic diagnosis via previously collected probe data

Affiliations

Wide-field spectral imaging of human ovary autofluorescence and oncologic diagnosis via previously collected probe data

Timothy E Renkoski et al. J Biomed Opt. 2012 Mar.

Abstract

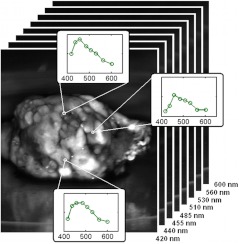
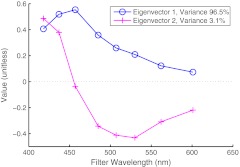
With no sufficient screening test for ovarian cancer, a method to evaluate the ovarian disease state quickly and nondestructively is needed. The authors have applied a wide-field spectral imager to freshly resected ovaries of 30 human patients in a study believed to be the first of its magnitude. Endogenous fluorescence was excited with 365-nm light and imaged in eight emission bands collectively covering the 400- to 640-nm range. Linear discriminant analysis was used to classify all image pixels and generate diagnostic maps of the ovaries. Training the classifier with previously collected single-point autofluorescence measurements of a spectroscopic probe enabled this novel classification. The process by which probe-collected spectra were transformed for comparison with imager spectra is described. Sensitivity of 100% and specificity of 51% were obtained in classifying normal and cancerous ovaries using autofluorescence data alone. Specificity increased to 69% when autofluorescence data were divided by green reflectance data to correct for spatial variation in tissue absorption properties. Benign neoplasm ovaries were also found to classify as nonmalignant using the same algorithm. Although applied ex vivo, the method described here appears useful for quick assessment of cancer presence in the human ovary.


Figures

Fig. 1
Fig. 1
Simplified optical layout of the multispectral imaging device (SEAtreat, Apogen Technologies, Inc., now QinetiQ North America, San Diego, CA). Each lens depicted represents multiple elements. The system used single excitation of 365 nm and eight fluorescence emission bands covering the visible range (400 to 640 nm). The system used white light illumination when capturing crossed-polarization reflectance images. QPAS allowed simultaneous capture of four uniquely filtered images on a single CCD.
Fig. 2
Fig. 2
Background: Multispectral image stack. Eight autofluorescence images of a whole human ovary were excited by 365-nm-filtered mercury lamp and each captured using a different bandpass filter between 400 and 640 nm. Foreground: An eight-point fluorescence spectrum of the tissue can be extracted at each pixel, given spatial registration of all the stack images.
Fig. 3
Fig. 3
Conversion of single-point spectral data. The input data was an excitation emission matrix (EEM) such as the one plotted at left. The emission spectrum for 365-nm excitation was selected from the EEM for processing, while the remaining data was discarded. At each collection wavelength, the fluorescence intensity of the measured spectrum was multiplied by the transmission of a filter used for multispectral imaging. These products were then summed over all wavelengths at which filter data existed. A matrix multiplication carried out this process for each of eight emission filters. (Matrix dimensions are given in brackets.) The result, plotted versus filter center wavelength, was an eight-point autofluorescence spectrum weighted for direct comparison to data from the MSI.
Fig. 4
Fig. 4
Histograms of autofluorescence intensities at 455-nm filter center wavelength, only including tissues confirmed normal by histopathology. (a) Filter-weighted, previously collected single-point measurements of ovarian biopsies. (b) Multispectral imaging measurements (on whole ovaries) averaged over the pixels in the ROI of a single ovary. Each histogram was fit to a gamma distribution. Datasets from spectrofluorometer and MSI were intensity equalized based on statistics of these measurements.
Fig. 5
Fig. 5
Normalized correction factor for the absolute spectral response of the multispectral imager (MSI), calculated using three different fluorescence standards. Images captured using filters of longer center wavelength must be scaled up in intensity to compensate for lower system sensitivity at longer wavelengths. Tetraphenylbutadiene correction factors were selected for scaling the first seven imaging bands. The correction factor for the 600-nm filter band was chosen according to the results from the Rhodamine B standard.
Fig. 6
Fig. 6
(a) Average calibrated fluorescence spectra from normal, cancer, and benign ovaries measured with the multispectral imager (MSI). (b) Average calibrated fluorescence spectra from normal, cancer, and benign ovarian biopsies measured as part of a previous study using single-point spectroscopy. All measurements were captured ex vivo with 365-nm excitation. (c) Results of dividing the average spectra collected by each device when observing normal tissue and when observing a cancer tissue. These data have each been normalized and fitted with a second-order curve. The curve from normal tissue is used to correct the shape of spectra captured by the MSI.
Fig. 7
Fig. 7
(a) Filter-weighted unnormalized training data measurements show a trend of lower autofluorescence intensity in histopathology-confirmed cancerous biopsies. (b) Filter-weighted training data measurements normalized by area under curve show no obvious spectral feature distinguishing normal and cancerous biopsies.
Fig. 8
Fig. 8
Results of principal component analysis (PCA). The first eigenvector, or principal component (PC), represents the vast majority of the variance in the training dataset, and its shape closely resembles the average spectrum. These facts indicate that the dataset can be classified fairly well by considering only the intensity of a measurement. The second PC accounts for a small fraction of the dataset variance and can be used to emphasize portions of the spectrum lower or higher than 455 nm.
Fig. 9
Fig. 9
Training set measurements, plotted in the space of the first two principal components (PCs). Normal and cancer groups overlap. Diagonal line is the decision boundary used for classification of test group measurements. Generally, PC #1 accounts for variations in intensity of measured spectra, and PC #2 accounts for differences in shape of measured spectra.
Fig. 10
Fig. 10
(a) Crossed-polarization reflectance image of a normal ovary with ROI outlined. (b), (d), and (f) Multispectral autofluorescence image data plotted in two-PC space. Measurements at each ROI pixel of the ovary shown in (a) are plotted over normal measurements of the training set. Diagonal line represents a decision boundary for classification, with the upper left region corresponding to a cancer classification and lower right to a normal classification. (c) and (e) Tissue classification maps superimposed on fluorescence images of the same ovary. Green ROI pixels indicate normal classification. Red pixels indicate cancer classification. (b) Before spectral shape correction, pixel measurements do not overlap well with the training set. (c) and (d) After spectral shape correction, the data overlap well, but only 76% of pixels classify as normal. (e) and (f) After division by green channel reflectance, more than 97% of pixels classify as normal.
Fig. 11
Fig. 11
(a) Crossed-polarization reflectance image of a large cancer ovary with ROI outlined. (b), (d), and (f) Multispectral autofluorescence image data plotted in two-PC space. Measurements at each ROI pixel of the ovary shown in (a) are plotted over normal measurements of the training set. Diagonal line represents a decision boundary for classification, with the upper left region corresponding to a cancer classification and lower right to a normal classification. (c) and (e) Tissue classification maps superimposed on fluorescence images of the same ovary. Green ROI pixels indicate normal classification. Red pixels indicate cancer classification. (b) Before spectral shape correction, pixel measurements of this ovary already fall on the cancer side of the decision boundary. (c) and (d) After spectral shape correction, 100% of pixels classify as cancer. (e) and (f) After division by green channel reflectance, pixel measurements lie farther to the cancer side of the decision boundary.
Fig. 12
Fig. 12
(a) Crossed-polarization reflectance image of a normal ovary with ROI outlined. Adipose tissue is prevalent on the ovary. (b) and (c) Tissue classification maps over the ROI of same ovary. Green ROI pixels indicate normal classification. Red pixels indicate cancer classification. Classification using shape-corrected fluorescence data is poor. Classification improves with incorporation of green reflectance data, but areas high in adipose tissue tend to misclassify. (d) and (e) Multispectral autofluorescence image data plotted in two-PC space. Pixel measurements fall on both sides of the decision boundary.

Similar articles

Cited by

References

    1. Cancer Facts & Figures 2010, American Cancer Society, Atlanta (2010).
    1. Auersperg N., et al. , “Ovarian surface epithelium: biology, endocrinology, and pathology,” Endocr. Rev. 22(2), 255–288 (2001).ERVIDP10.1210/er.22.2.255 - DOI - PubMed
    1. Richards-Kortum R., Sevick-Muraca E., “Quantitative optical spectroscopy for tissue diagnosis,” Annu. Rev. Phys. Chem. 47, 555–606 (1996).ARPLAP10.1146/annurev.physchem.47.1.555 - DOI - PubMed
    1. Brewer M., et al. , “Fluorescence spectroscopy for in vivo characterization of ovarian tissue,” Lasers Surg. Med. 29(2), 128–135 (2001).LSMEDI10.1002/(ISSN)1096-9101 - DOI - PubMed
    1. Papazoglou T. G., “Malignancies and atherosclerotic plaque diagnosis—is laser induced fluorescence spectroscopy the ultimate solution?” J. Photochem. Photobiol. B 28(1), 3–11 (1995).JPPBEG10.1016/1011-1344(95)07126-M - DOI - PubMed

Publication types