. 2012 May 4;90(5):809-20.
doi: 10.1016/j.ajhg.2012.03.014. Epub 2012 Apr 12.

Genetic adaptation of fatty-acid metabolism: a human-specific haplotype increasing the biosynthesis of long-chain omega-3 and omega-6 fatty acids

Affiliations

Genetic adaptation of fatty-acid metabolism: a human-specific haplotype increasing the biosynthesis of long-chain omega-3 and omega-6 fatty acids

Adam Ameur et al. Am J Hum Genet. .

Abstract

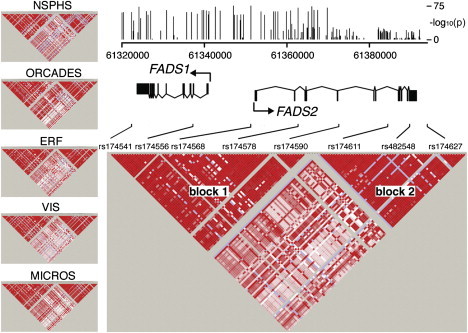
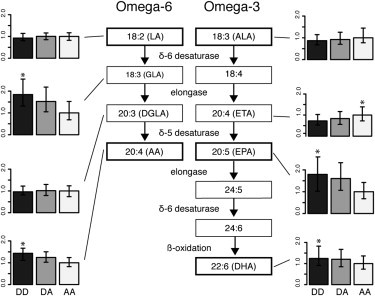
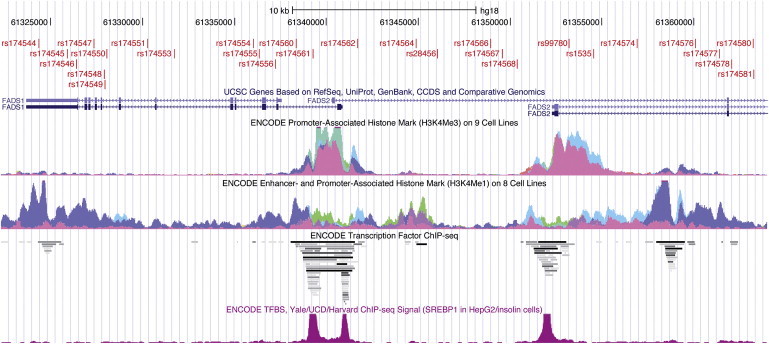
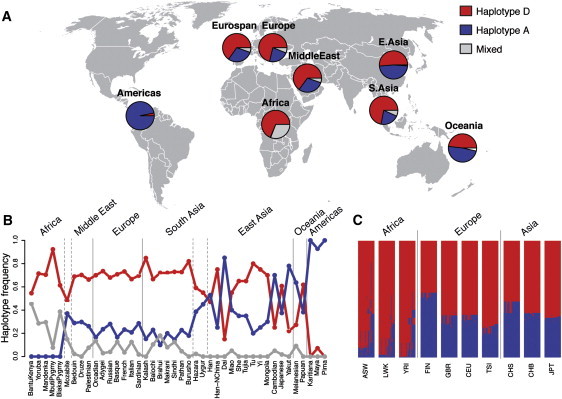
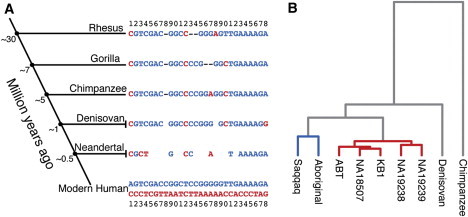
Omega-3 and omega-6 long-chain polyunsaturated fatty acids (LC-PUFAs) are essential for the development and function of the human brain. They can be obtained directly from food, e.g., fish, or synthesized from precursor molecules found in vegetable oils. To determine the importance of genetic variability to fatty-acid biosynthesis, we studied FADS1 and FADS2, which encode rate-limiting enzymes for fatty-acid conversion. We performed genome-wide genotyping (n = 5,652 individuals) and targeted resequencing (n = 960 individuals) of the FADS region in five European population cohorts. We also analyzed available genomic data from human populations, archaic hominins, and more distant primates. Our results show that present-day humans have two common FADS haplotypes-defined by 28 closely linked SNPs across 38.9 kb-that differ dramatically in their ability to generate LC-PUFAs. No independent effects on FADS activity were seen for rare SNPs detected by targeted resequencing. The more efficient, evolutionarily derived haplotype appeared after the lineage split leading to modern humans and Neanderthals and shows evidence of positive selection. This human-specific haplotype increases the efficiency of synthesizing essential long-chain fatty acids from precursors and thereby might have provided an advantage in environments with limited access to dietary LC-PUFAs. In the modern world, this haplotype has been associated with lifestyle-related diseases, such as coronary artery disease.


Figures

Figure 1
Figure 1
LD Pattern in the FADS Region LD display of the five population cohorts from Sweden (NSPHS), Scotland (ORCADES), The Netherlands (ERF), Croatia (VIS), and Italy (MICROS) (left) and of all individuals combined (bottom right). Color schemes in all LD maps are based on the standard (D'/LOD) option in the Haploview software. The genomic coordinates on chromosome 11 (hg18) are shown at the top right, and the locations of eight SNPs are drawn out as positional guides. The vertical black bars show p values for each individual SNP; p values range from 1 to 10−75 and represent the association with the lipid PC 36:4. See Table S1 for a complete list of p values for all SNPs in the region.
Figure 2
Figure 2
Effect of Haplotype on Synthesis of PUFAs in the Omega-3 and Omega-6 Pathways Measurements of the omega-3 and 6 fatty-acid levels in the NSPHS population. The three bars in each of the smaller plots (labeled DD, DA, and AA) represent levels of fatty acids in individuals homozygous (AA and DD) and heterozygous (DA) for the A and D haplotypes. Fatty-acid measurements have been scaled so that the average levels for the individuals homozygous for haplotype A are set to 1. The error bars represent the upper and lower quartiles for the PUFA measurements. Asterisks () indicate p values < 10−3.
Figure 3
Figure 3
Transcriptional Regulation Elements in the FADS Region The figure shows a UCSC Genome Browser view of the FADS region; the 28 SNPs define the two haplotypes A and D indicated in red (at the top). The two tracks in the middle show promoter- and enhancer-associated histone marks identified in cell-line studies within the ENCODE project. Below is a track displaying transcription-factor binding in the region as identified by ENCODE ChIP-seq experiments. The track at the bottom shows the binding profile for the transcription factor SREBP1 in HepG2 cells; this protein has been shown to affect expression of both FADS1 and FADS2 in mice. Many of the SNPs that distinguish haplotype A from D are located inside or in close proximity to the binding sites of regulatory molecules.
Figure 4
Figure 4
Distribution of FADS Haplotypes in Human Populations (A) The frequencies of the A (blue) and D (red) haplotypes on different continents are based on four SNPs genotyped in the HGDP populations. The remaining fractions represent mixes (gray) of haplotypes A and D. In Europe, data for the same four SNPs are included for all genotyped individuals in our five local population cohorts (EUROSPAN). (B) Frequencies of A, D, and mixed haplotypes in HGDP populations in which at least ten individuals have been genotyped. (C) Frequencies of the 28 SNPs on the FADS haplotypes for ten HapMap and 1,000 Genomes populations of African, European, and Asian ancestry. Phased SNP data for all chromosomes in a population are shown as colored rows. Each row consists of 28 elements, one for each SNP on the two main haplotypes. A SNP is colored blue if it is located on haplotype A and colored red if it is on haplotype D. Mixed haplotypes are represented by horizontal lines that contain both red and blue elements.
Figure 5
Figure 5
Evolution of FADS Haplotypes (A) The 28 SNPs distinguishing the two main haplotypes in modern humans are shown at the bottom (haplotype A in red letters, D in blue), and the corresponding nucleotides in primates and archaic hominins are aligned above. The nucleotides for rhesus macaques, gorillas, and chimpanzees are taken from their respective reference genomes (rheMac2, gorGor3, and panTro2). Positions marked by hyphens are missing from the reference assemblies and probably represent deletions. For the archaic hominins, all nucleotides identified by at least ten reads (Denisovan) and two reads (Neanderthal) by Illumina sequencing are shown (see Table S2 for detailed data). Empty cells indicate positions with no sequence-read information as a result of either insufficient coverage or a deletion. (B) Dendrogram—resulting from a hierarchical clustering via the UPGMA method—of pair-wise nucleotide differences in the FADS region between five DD individuals, two AA individuals, the Denovisan, and one chimpanzee. AA genotypes are depicted with blue branches, and DD genotypes are depicted with red branches.

References

    1. Leonard W.R., Snodgrass J.J., Robertson M.L. Evolutionary Perspectives on Fat Ingestion and Metabolism in Humans. In: Montmighteur J.P., le Coutre J., editors. Fat Detection: Taste, Texture, and Post Ingestive Effects. CRC Press; Boca Raton, FL: 2010. - PubMed
    1. Darios F., Davletov B. Omega-3 and omega-6 fatty acids stimulate cell membrane expansion by acting on syntaxin 3. Nature. 2006;440:813–817. - PubMed
    1. Marszalek J.R., Lodish H.F. Docosahexaenoic acid, fatty acid-interacting proteins, and neuronal function: Breastmilk and fish are good for you. Annu. Rev. Cell Dev. Biol. 2005;21:633–657. - PubMed
    1. Ratnayake W.M., Galli C. Fat and fatty acid terminology, methods of analysis and fat digestion and metabolism: A background review paper. Ann. Nutr. Metab. 2009;55:8–43. - PubMed
    1. Nakamura M.T., Nara T.Y. Structure, function, and dietary regulation of delta6, delta5, and delta9 desaturases. Annu. Rev. Nutr. 2004;24:345–376. - PubMed

Publication types

MeSH terms

LinkOut - more resources