Review
. 2012 Aug;33(4):318-75.
doi: 10.1016/j.mam.2012.03.005. Epub 2012 Apr 6.

Nutritional modulation of age-related macular degeneration

Affiliations
Review

Nutritional modulation of age-related macular degeneration

Karen A Weikel et al. Mol Aspects Med. 2012 Aug.

Abstract

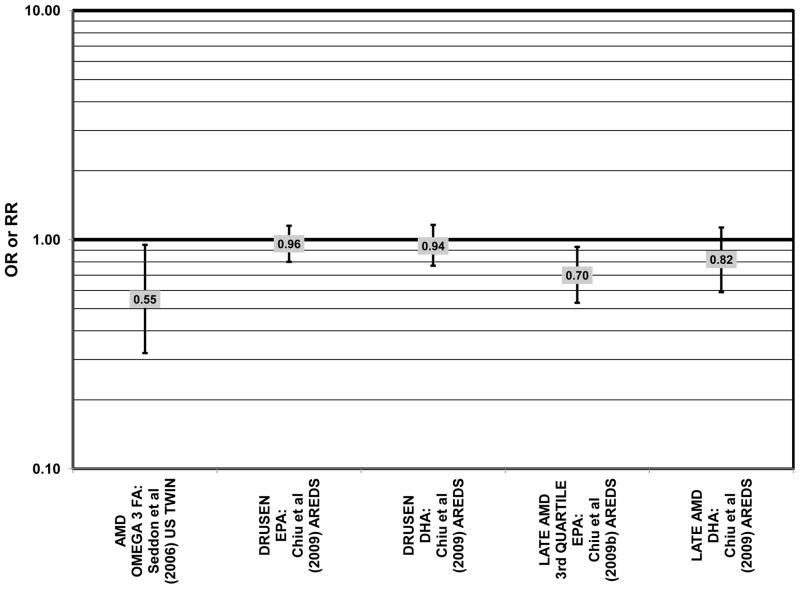
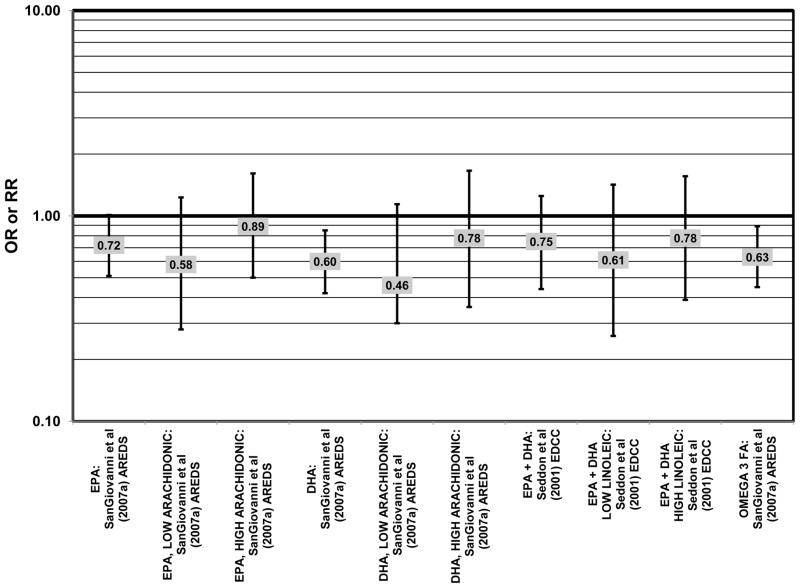
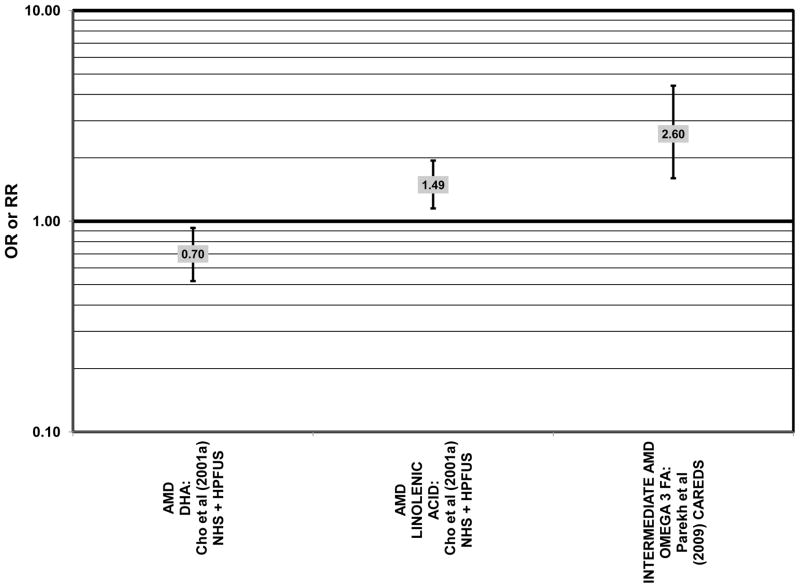
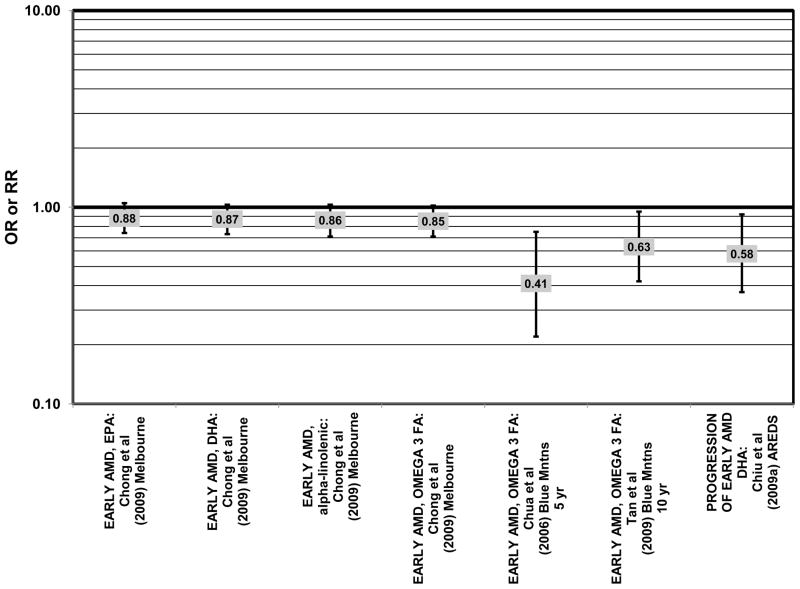
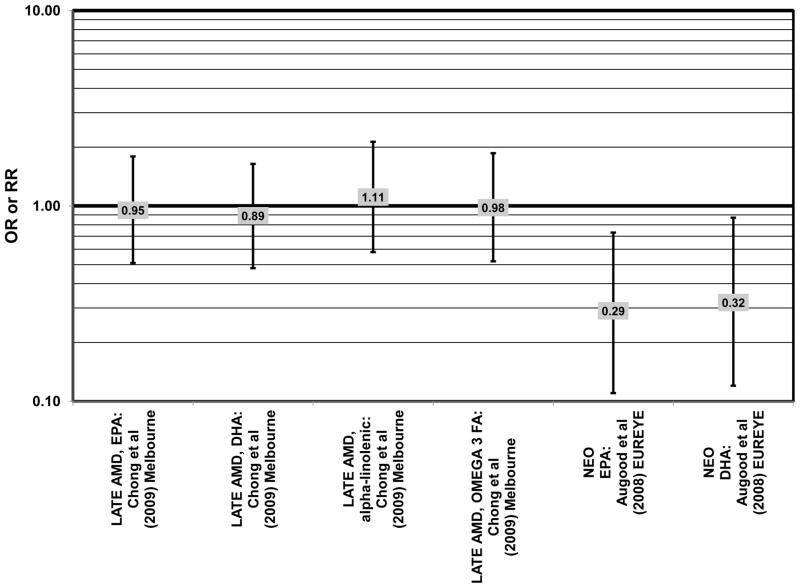
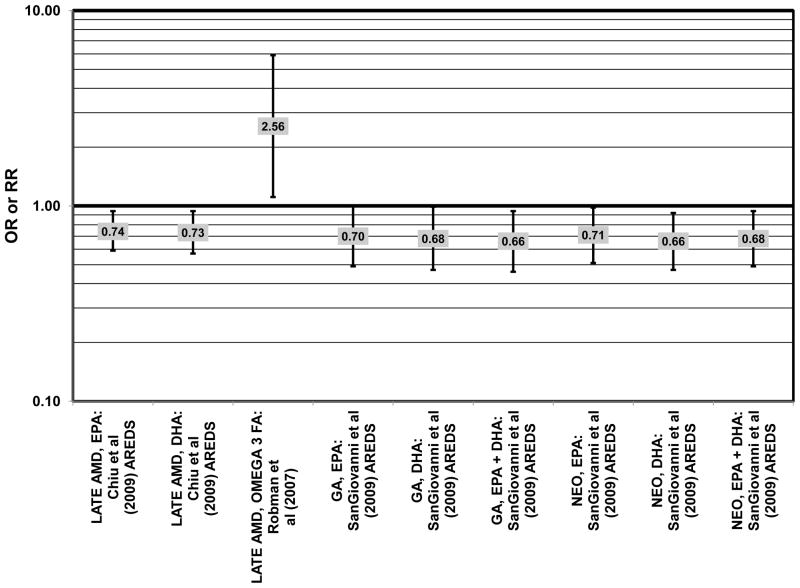
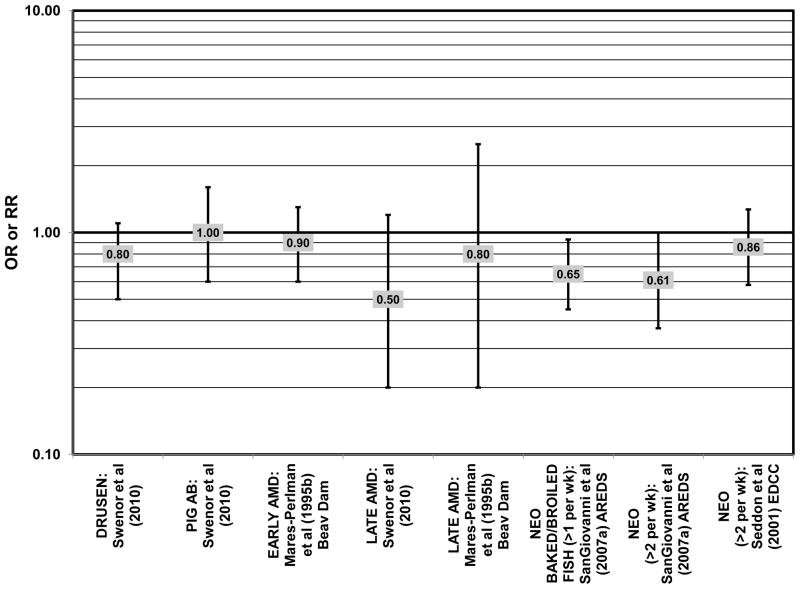
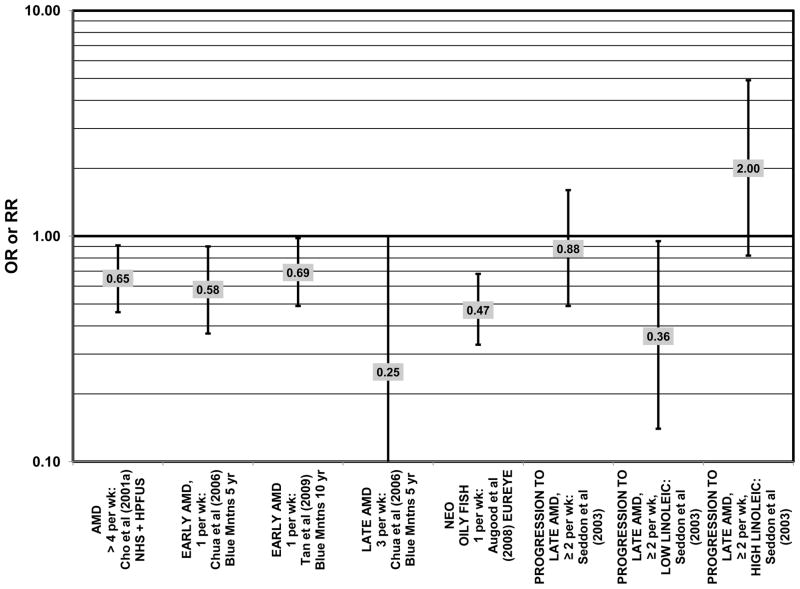
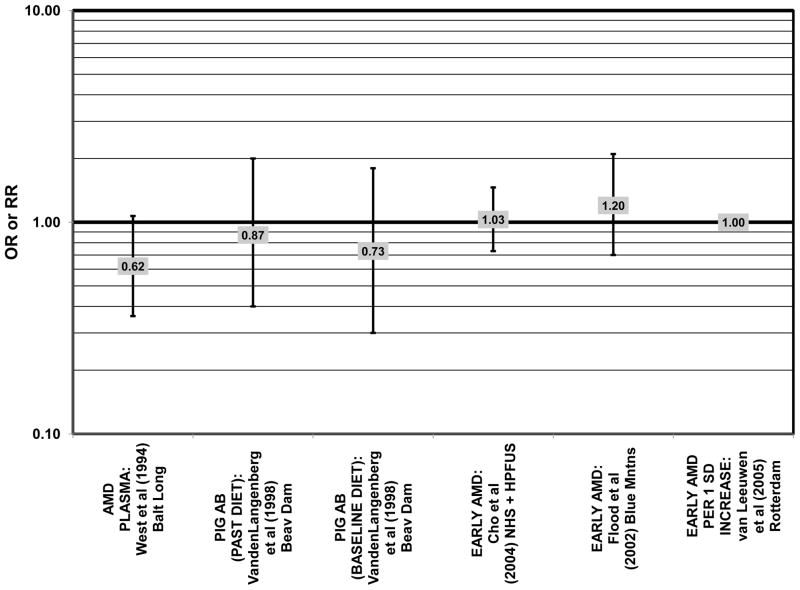
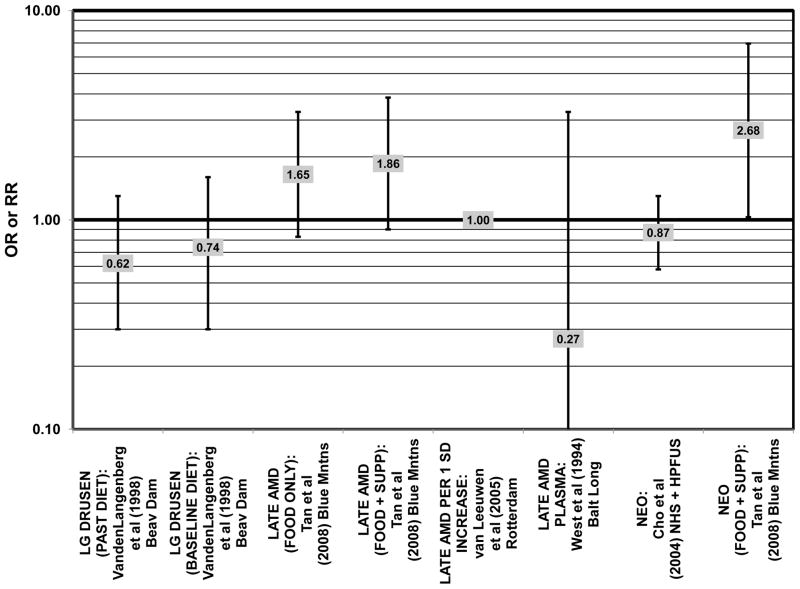
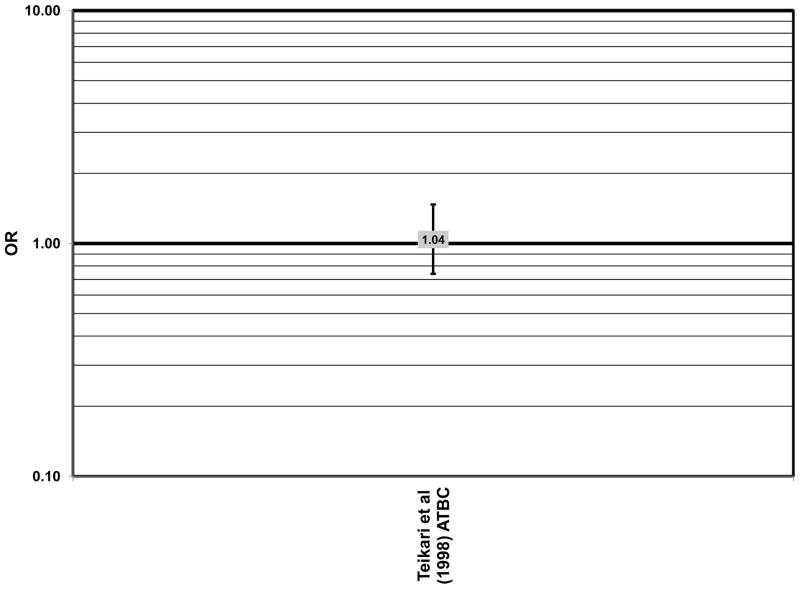
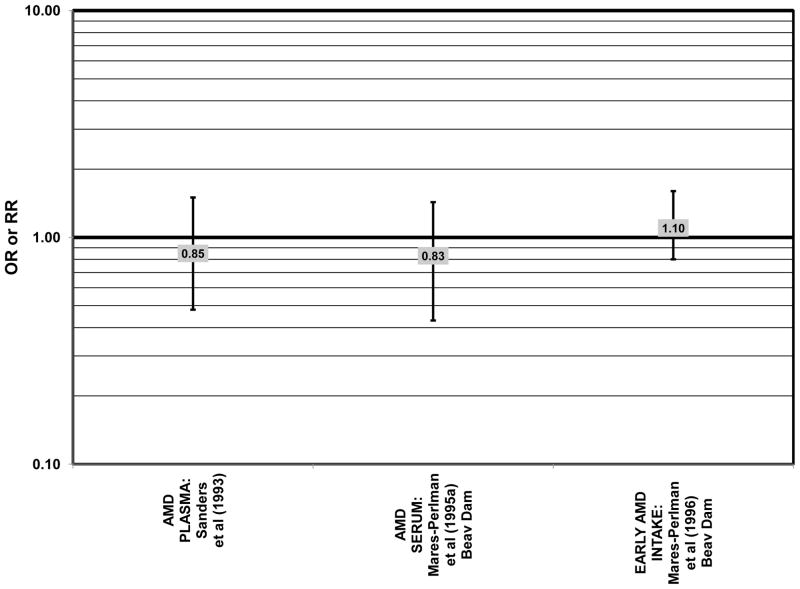
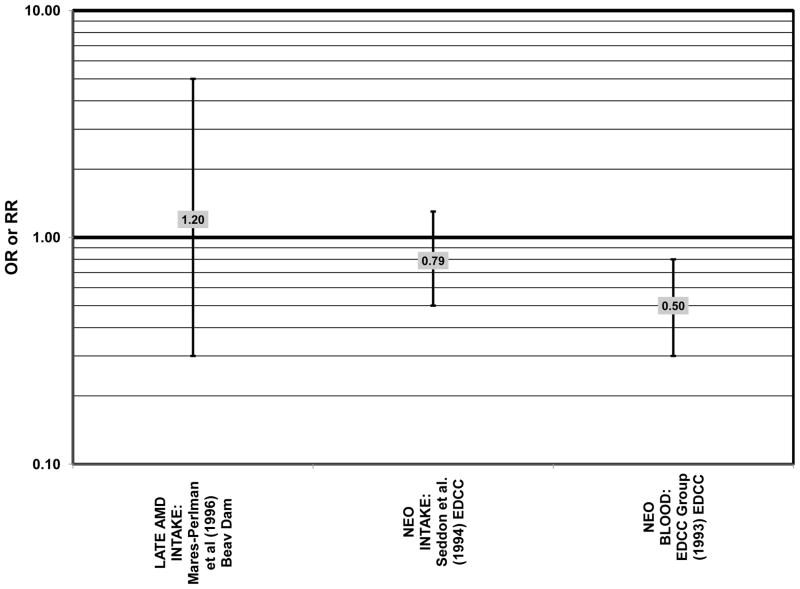
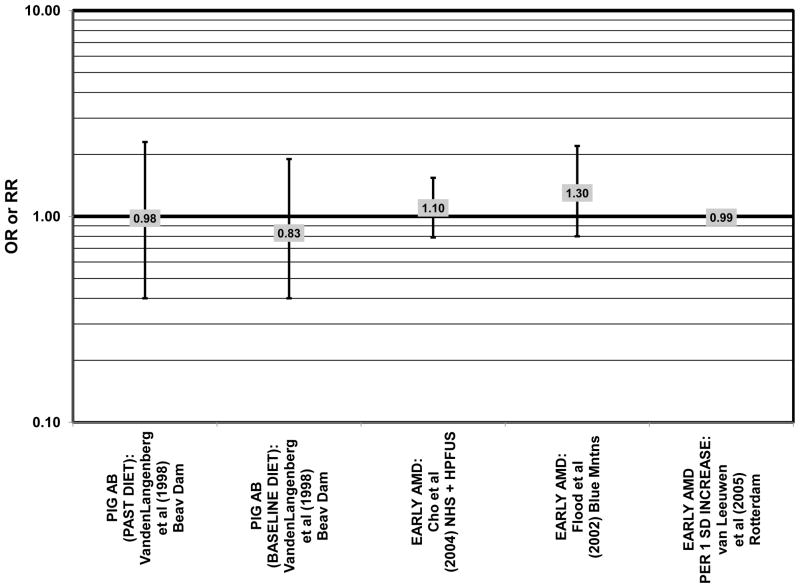
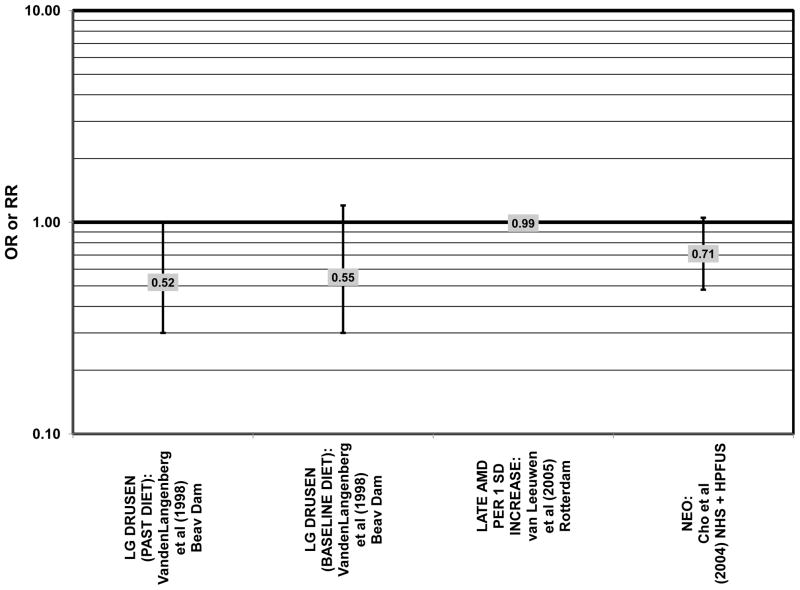
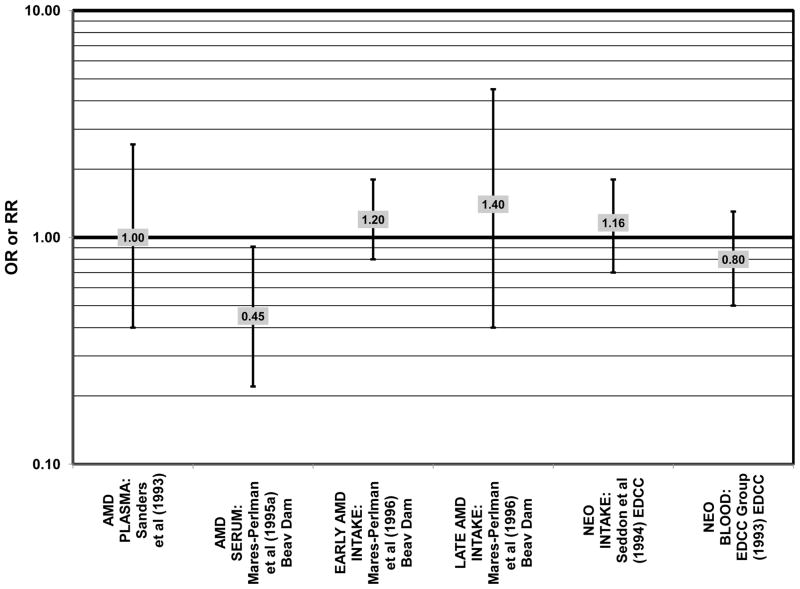
Age-related macular degeneration (AMD) is the leading cause of blindness in the elderly worldwide. It affects 30-50 million individuals and clinical hallmarks of AMD are observed in at least one third of persons over the age of 75 in industrialized countries (Gehrs et al., 2006). Costs associated with AMD are in excess of $340 billion US (American-Health-Assistance-Foundation, 2012). The majority of AMD patients in the United States are not eligible for clinical treatments (Biarnes et al., 2011; Klein et al., 2011). Preventive interventions through dietary modulation are attractive strategies because many studies suggest a benefit of micro- and macronutrients with respect to AMD, as well as other age-related debilities, and with few, if any, adverse effects (Chiu, 2011). Preservation of vision would enhance quality of life for millions of elderly people, and alleviate the personal and public health financial burden of AMD (Frick et al., 2007; Wood et al., 2011). Observational studies indicate that maintaining adequate levels of omega-3 fatty acids (i.e. with 2 servings/week of fish) or a low glycemic index diet may be particularly beneficial for early AMD and that higher levels of carotenoids may be protective, most probably, against neovascular AMD. Intervention trials are needed to better understand the full effect of these nutrients and/or combinations of nutrients on retinal health. Analyses that describe effects of a nutrient on onset and/or progress of AMD are valuable because they indicate the value of a nutrient to arrest AMD at the early stages. This comprehensive summary provides essential information about the value of nutrients with regard to diminishing risk for onset or progress of AMD and can serve as a guide until data from ongoing intervention trials are available.


Figures

Figure 1
Figure 1
Odds or risk ratio for any stage of AMD, drusen or late AMD with high vs. low intake of omega-3 fatty acids in retrospective and cross-sectional studies.
Figure 2
Figure 2
Odds or risk ratio for neovascular AMD with high vs. low intake of omega-3 fatty acids in retrospective and cross-sectional studies.
Figure 3
Figure 3
Odds or risk ratio for any stage or intermediate AMD with high vs. low intake of omega-3 fatty acids in prospective studies.
Figure 4
Figure 4
Odds or risk ratio for early AMD or its progression with high vs. low intake of omega-3 fatty acids in prospective studies.
Figure 5
Figure 5
Odds or risk ratio for late AMD with high vs. low intake of omega-3 fatty acids in prospective studies.
Figure 6
Figure 6
Odds or risk ratio for progression to late AMD with high vs. low intake of omega-3 fatty acids in prospective studies.
Figure 7
Figure 7
Odds or risk ratio for drusen, pigment abnormalities, early or late AMD with fish intake in retrospective and cross-sectional studies.
Figure 8
Figure 8
Odds or risk ratio for any stage, early or late AMD or progression to late AMD with fish intake in prospective studies.
Figure 9
Figure 9
Odds or risk ratio for early or late AMD with high vs. low intake of omega-6 fatty acids in retrospective and cross-sectional studies.
Figure 10
Figure 10
Odds or risk ratio for early, intermediate or late AMD or its progression with high vs. low intake of omega-6 fatty acids in prospective studies.
Figure 11
Figure 11
Odds or risk ratio for early, intermediate or late AMD or progression to late AMD with high vs. low intake of fat-containing foods in retrospective and prospective studies.
Figure 12
Figure 12
Odds or risk ratio for early or late AMD with high vs. low intake of polyunsaturated fatty acids in retrospective, cross-sectional, and prospective studies.
Figure 13
Figure 13
Odds or risk ratio for early or late AMD with high vs. low intake of monounsaturated fatty acids in retrospective and cross-sectional studies.
Figure 14
Figure 14
Odds or risk ratio for early, intermediate or late AMD with high vs. low intake of monounsaturated fatty acids in prospective studies.
Figure 15
Figure 15
Odds or risk ratio for early, intermediate or late AMD with high vs. low intake of saturated fat in retrospective, cross-sectional, and prospective studies.
Figure 16
Figure 16
Odds or risk ratio for early or late AMD with high vs. low intake trans fatty acids in retrospective and prospective studies.
Figure 17
Figure 17
Odds or risk ratio for early or late AMD with high vs. low intake of dietary cholesterol in retrospective, cross-sectional, and prospective studies.
Figure 18
Figure 18
Odds or risk ratio for early or late AMD with high vs. low intake of total fat in retrospective and cross-sectional studies.
Figure 19
Figure 19
Odds or risk ratio for any stage, early, intermediate or late AMD or progression to late AMD with high vs. low intake of total fat in prospective studies.
Figure 20
Figure 20
Odds or risk ratio for drusen or any stage of AMD with high vs. low intake of a high glycemic index diet in cross-sectional studies.
Figure 21
Figure 21
Odds or risk ratio for pigment abnormalities, drusen, early AMD or progression to late AMD with high vs. low intake of a high glycemic index diet in prospective studies.
Figure 22
Figure 22
Odds or risk ratio for pigment abnormalities, drusen or early AMD with high vs. low intake of low glycemic index foods in a prospective study.
Figure 23
Figure 23
Odds or risk ratio for drusen or any stage of AMD with high vs. low intake of total carbohydrates in cross-sectional studies.
Figure 24
Figure 24
Odds or risk ratio for any stage of AMD with high vs. low blood levels of lutein (LUT) and/or zeaxanthin (ZEA) in retrospective and cross-sectional studies.
Figure 25
Figure 25
Odds or risk ratio for pigment abnormalities with high vs. low intake of lutein and zeaxanthin in a cross-sectional study.
Figure 26
Figure 26
Odds or risk ratio for pigment abnormalities with high vs. low serum levels of lutein and zeaxanthin in a cross-sectional study.
Figure 27
Figure 27
Odds or risk ratio for soft drusen with high vs. low intake of lutein and zeaxanthin in a cross-sectional study.
Figure 28
Figure 28
Odds or risk ratio for soft drusen with high vs. low serum levels of lutein and zeaxanthin in Non-Hispanic Whites in a cross-sectional study.
Figure 29
Figure 29
Odds or risk ratio for drusen or early AMD with high vs. low intake from food of lutein and/or zeaxanthin in retrospective and cross-sectional studies.
Figure 30
Figure 30
Odds or risk ratio for late AMD with high vs. low intake of lutein (LUT) and/or zeaxanthin (ZEA) from food in retrospective and cross-sectional studies.
Figure 31
Figure 31
Odds or risk ratio for neovascular AMD with high vs. low intake (with or without supplements) or blood levels of lutein (LUT) and/or zeaxanthin (ZEA) in retrospective and cross-sectional studies.
Figure 32
Figure 32
Odds or risk ratio for any stage or progression through AMD with high vs. low intake of lutein and zeaxanthin in prospective studies.
Figure 33
Figure 33
Odds or risk ratio for pigment abnormalities or early AMD with high vs. low intake of lutein and zeaxanthin in prospective studies.
Figure 34
Figure 34
Odds or risk ratio for drusen or late AMD with high vs. low intake of lutein and zeaxanthin in prospective studies.
Figure 35
Figure 35
Odds or risk ratio for neovascular AMD with high vs. low intake of lutein and zeaxanthin in prospective studies.
Figure 36
Figure 36
Odds or risk ratio for any stage of AMD with high vs. low blood levels of beta-carotene in retrospective and cross-sectional studies.
Figure 37
Figure 37
. Odds or risk ratio for drusen or early AMD with high vs. low intake or blood levels of beta-carotene in retrospective and cross-sectional studies.
Figure 38
Figure 38
Odds or risk ratio for late AMD with high vs. low intake or blood levels of beta-carotene in retrospective and cross-sectional studies.
Figure 39
Figure 39
Odds or risk ratio for any stage of AMD, pigment abnormalities or early AMD with high vs. low intake or blood levels of beta-carotene in prospective studies.
Figure 40
Figure 40
Odds or risk ratio for drusen or late AMD with high vs. low intake of beta-carotene in prospective studies.
Figure 41
Figure 41
Odds ratio for any stage of AMD upon supplementation with beta-carotene in an intervention study.
Figure 42
Figure 42
Odds or risk ratio for any stage or early AMD with high vs. low intake or blood levels of alpha-carotene in retrospective and cross-sectional studies.
Figure 43
Figure 43
Odds or risk ratio for late AMD with high vs. low intake or blood levels of alpha-carotene in retrospective and cross-sectional studies.
Figure 44
Figure 44
Odds or risk ratio for pigment abnormalities or early AMD with high vs. low intake of alpha-carotene in prospective studies.
Figure 45
Figure 45
Odds or risk ratio for drusen on late AMD with high vs. low intake of alpha-carotene in prospective studies.
Figure 46
Figure 46
Odds or risk ratio for any stage, early or late AMD with high vs. low intake or blood levels of lycopene in retrospective and cross-sectional studies.
Figure 47
Figure 47
Odds or risk ratio for any stage, early or late AMD with high vs. low intake or blood levels of lycopene in prospective studies.
Figure 48
Figure 48
Odds or risk ratio for any stage, early or late AMD with high vs. low intake or blood levels of cryptoxanthin in retrospective and cross-sectional studies.
Figure 49
Figure 49
Odds or risk ratio for any stage, early or neovascular AMD with high vs. low intake of cryptoxanthin in prospective studies.
Figure 50
Figure 50
Odds or risk ratio for neovascular or early AMD with high vs. low intake or blood levels of total carotenoids in retrospective and prospective studies.
Figure 51
Figure 51
Odds or risk ratio for any stage of AMD with high vs. low intake or blood levels of vitamin A or retinol in retrospective and cross-sectional studies.
Figure 52
Figure 52
Odds or risk ratio for late AMD with high vs. low intake (with or without supplements) of vitamin A or retinol in retrospective and cross-sectional studies.
Figure 53
Figure 53
Odds or risk ratio for any stage of AMD, pigment abnormalities or early AMD with high vs. low intake or blood levels of pro-vitamin A carotenoids (PRO-A), vitamin A, or retinol in prospective studies.
Figure 54
Figure 54
Odds or risk ratio for large drusen or late AMD with high vs. low intake (with or without supplements) or blood levels of pro-vitamin A carotenoids (PRO-A), vitamin A, retinol equivalents of vitamin A, or retinol in prospective studies.
Figure 55
Figure 55
Odds or risk ratio for neovascular AMD with high vs. low intake (with or without supplements) of vitamin A or retinol equivalents of vitamin A in prospective studies.
Figure 56
Figure 56
Odds or risk ratio for any stage of AMD with high vs. low blood levels of vitamin E in retrospective and cross-sectional studies.
Figure 57
Figure 57
Odds or risk ratio for drusen or early AMD with high vs. low intake or blood levels of vitamin E in retrospective and cross-sectional studies.
Figure 58
Figure 58
Odds or risk ratio for late AMD with high vs. low intake (with or without supplements) of vitamin E in retrospective and cross-sectional studies.
Figure 59
Figure 59
Odds or risk ratio for late AMD with high vs. low blood levels of vitamin E in retrospective and cross-sectional studies.
Figure 60
Figure 60
Odds or risk ratio for any stage of AMD with high vs. low intake (with or without supplements) or blood levels of vitamin E in prospective studies.
Figure 61
Figure 61
Odds or risk ratio for pigment abnormalities, indicators of early AMD or early AMD with high vs. low intake (with or without supplements) or blood levels of vitamin E in prospective studies.
Figure 62
Figure 62
Odds or risk ratio for large drusen or late AMD with high vs. low intake (with or without supplements) or blood levels of vitamin E in prospective studies.
Figure 63
Figure 63
Odds or risk ratio for any stage, early, visually significant (“VIS SIG”) or late AMD upon supplementation with vitamin E in intervention studies.
Figure 64
Figure 64
Odds or risk ratio for any stage of AMD with high vs. low intake or blood levels of vitamin C in retrospective and cross-sectional studies.
Figure 65
Figure 65
Odds or risk ratio for drusen or early AMD with high vs. low vitamin C intake (with or without supplements) in retrospective and cross-sectional studies.
Figure 66
Figure 66
Odds or risk ratio for late AMD with high vs. low intake (with or without supplements) or blood levels of vitamin C in retrospective and cross-sectional studies.
Figure 67
Figure 67
Odds or risk ratio for any stage of AMD with high vs. low intake (with or without supplements) or blood levels of vitamin C in prospective studies.
Figure 68
Figure 68
Odds or risk ratio for pigment abnormalities or early AMD with high vs. low intake (with or without supplements) of vitamin C in prospective studies.
Figure 69
Figure 69
Odds or risk ratio for large drusen or late AMD with high vs. low intake (with or without supplements) or blood levels of vitamin C in prospective studies.
Figure 70
Figure 70
Odds or risk ratio for drusen, lesions or early AMD with high vs. low dietary score, antioxidant index (AOX) intake or use of multivitamin supplements in retrospective and cross-sectional studies.
Figure 71
Figure 71
Odds or risk ratio for late AMD with high vs. low antioxidant index (AOX) intake or blood levels, dietary score or use of multivitamin supplements in retrospective and cross-sectional studies.
Figure 72
Figure 72
Odds or risk ratio for any stage, early or late AMD or progression to late AMD with high vs. low intake of an antioxidant combination or use of multivitamin supplements in prospective studies and an intervention study.
Figure 73
Figure 73
Odds or risk ratio for drusen, pigment abnormalities, early or late AMD with high vs. low intake of fish with a high zinc content or zinc in retrospective and cross-sectional studies.
Figure 74
Figure 74
Odds or risk ratio for any stage of AMD, pigment abnormalities, early or late AMD, or progression to late AMD with high vs. low intake (with or without supplements) of zinc in prospective and intervention studies.
Figure 75
Figure 75
Odds or risk ratio for pigment abnormalities, soft drusen, early or late AMD with high vs. low serum levels of vitamin D in a retrospective study.
Figure 76
Figure 76
Odds ratio for pigment abnormalities, soft drusen, early or late AMD with high vs. low intake of milk or fish in those at least 40 years of age in a retrospective study.
Figure 77
Figure 77
Odds or risk ratio for pigment abnormalities, drusen, early or late AMD upon vitamin D supplementation or with high vs. low serum levels of vitamin D in those at least 40 years of age who do not consume milk daily in a retrospective study.

References

    1. Al-Hussaini H, Schneiders M, Lundh P, Jeffery G. Drusen are associated with local and distant disruptions to human retinal pigment epithelium cells. Exp Eye Res. 2009;88 (3):610–612. - PubMed
    1. Allikmets R, Shroyer NF, Singh N, Seddon JM, Lewis RA, Bernstein PS, Peiffer A, Zabriskie NA, Li Y, Hutchinson A, Dean M, Lupski JR, Leppert M. Mutation of the Stargardt disease gene (ABCR) in age-related macular degeneration. Science. 1997;277 (5333):1805–1807. - PubMed
    1. American-Health-Assistance-Foundation. Facts on Macular Degeneration, Macular Degeneration Research. American Health Assistance Foundation; Clarksburg, MD: 2012.
    1. AREDS-Group. A randomized, placebo-controlled, clinical trial of high-dose supplementation with vitamins C and E and beta carotene for age-related cataract and vision loss: AREDS report no. 9. Arch Ophthalmol. 2001;119 (10):1439–1452. - PMC - PubMed
    1. AREDS. A randomized, placebo-controlled, clinical trial of high-dose supplementation with vitamins C and E, beta carotene, and zinc for age-related macular degeneration and vision loss: AREDS report no. 8. Arch Ophthalmol. 2001;119 (10):1417–1436. - PMC - PubMed

Publication types