Review
. 2012 Jun;57(2):234-48.
doi: 10.1016/j.ymeth.2012.03.031. Epub 2012 Apr 5.

High-throughput screening for genes that prevent excess DNA replication in human cells and for molecules that inhibit them

Affiliations
Review

High-throughput screening for genes that prevent excess DNA replication in human cells and for molecules that inhibit them

Chrissie Y Lee et al. Methods. 2012 Jun.

Abstract

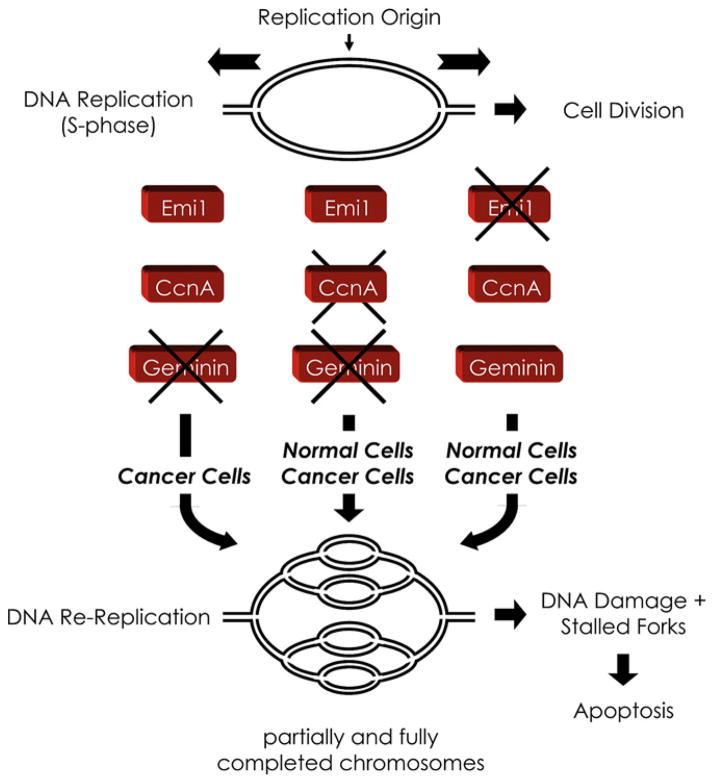
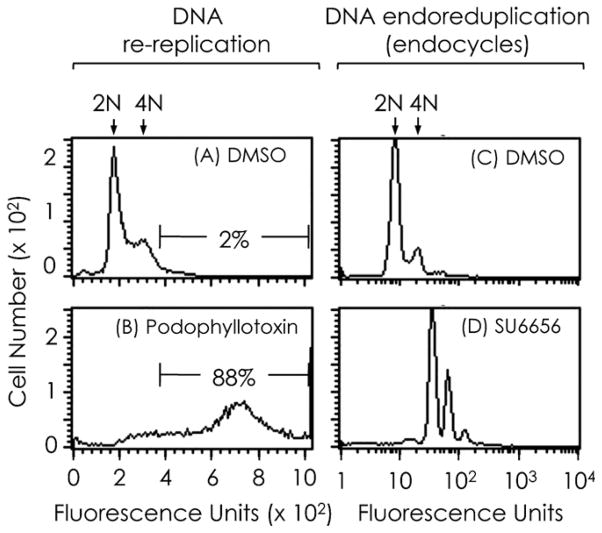
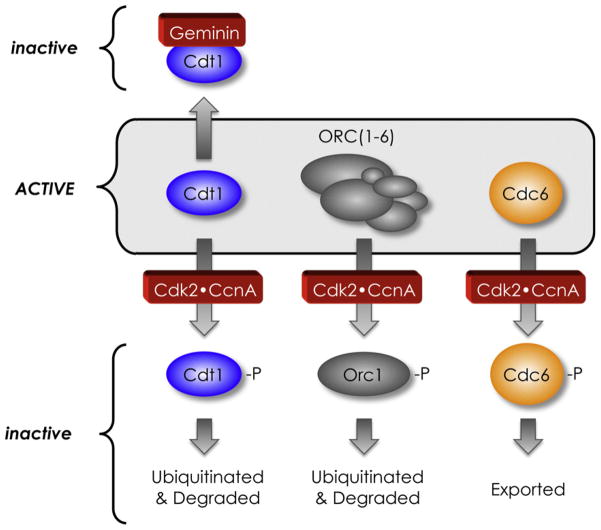
High-throughput screening (HTS) provides a rapid and comprehensive approach to identifying compounds that target specific biological processes as well as genes that are essential to those processes. Here we describe a HTS assay for small molecules that induce either DNA re-replication or endoreduplication (i.e. excess DNA replication) selectively in cells derived from human cancers. Such molecules will be useful not only to investigate cell division and differentiation, but they may provide a novel approach to cancer chemotherapy. Since induction of DNA re-replication results in apoptosis, compounds that selectively induce DNA re-replication in cancer cells without doing so in normal cells could kill cancers in vivo without preventing normal cell proliferation. Furthermore, the same HTS assay can be adapted to screen siRNA molecules to identify genes whose products restrict genome duplication to once per cell division. Some of these genes might regulate the formation of terminally differentiated polyploid cells during normal human development, whereas others will prevent DNA re-replication during each cell division. Based on previous studies, we anticipate that one or more of the latter genes will prove to be essential for proliferation of cancer cells but not for normal cells, since many cancer cells are deficient in mechanisms that maintain genome stability.


Figures

Fig. 1
Fig. 1
Induction of DNA re-replication. In cancer cells, siRNA suppression of geminin induces a second round of nuclear DNA replication prior to cell division that produces a mixture of partially and fully replicated chromosomes. This phenomenon is termed ‘DNA re-replication’ and results in apoptosis instead of cell division. In normal cells, suppression of geminin alone is insufficient to induce DNA re-replication, but suppression of both geminin and cyclin A2 (CcnA) does induce DNA re-replication. Thus, normal cells employ both geminin and at least one Cdk2·CcnA phosphorylation event (Fig. 3) to prevent initiation of DNA replication during S, G2 and early M phases, whereas cancer cells rely solely on geminin. Suppression of Emi1 alone can induce DNA re-replication in both normal cells and cancer cells, because Emi1 prevents premature activation of the ubiquitin ligase (anaphase promoting complex) that targets both geminin and cyclin A for destruction during M phase (Fig. 5).
Fig. 2
Fig. 2
Induction of DNA re-replication and endocycles in cancer cells. Proliferating SW480 cells were treated for 2 days with 46 μM DMSO (panels A, C), or with 3 μM podophyllotoxin dissolved in DMSO (panel B), or with 6 μM SU6656 dissolved in DMSO (panel D). Their DNA content was then determined by FACS analysis and displayed on either a linear (A, B) or exponential (C, D) scale. Podophylotoxin induced DNA re-replication characterized by the accumulation of cells between 4 and 8 N DNA content. SU6656 induced endocycles characterized by the accumulation of cells with 8, 16 and 32 N DNA content. Reproduced from [11].
Fig. 3
Fig. 3
Prereplication complexes. During the transition from anaphase to G1 phase of the mammalian cell division cycle, the DNA helicase loader [ORC(1–6),·Cdc6, and Cdt1] loads two copies of the replicative DNA helicase [Mcm(2–7)] onto DNA replication origins to form a prereplication complex. Once S phase begins, the two helicases unwind DNA in opposite direction, each in concert with a DNA replication machine. The helicase loader remains at the replication origin of one of the two sister chromatids.
Fig. 4
Fig. 4
Inactivation of prereplication complexes. Once DNA replication begins, proteins essential for assembly and activity of prereplication complexes are inactivated to prevent a second round of DNA replication from occurring within a single cell division cycle. Binding to the protein geminin inactivates Cdt1. Cdk2·CcnA inhibits Cdt1, Orc1, and Cdc6 activities by phosphorylating these proteins. Cdt1-P and Orc1-P are ubiquitinated by CRL1·Skp2 and thereby targeted for degradation by the 26S proteasome. Cdc6-P is exported from the nucleus. Cdt1-P and Orc1-P are ubiquitinated by CRL1·Skp2. Non-phosphorylated Cdt1·PCNA·DNA complexes that form during S-phase are ubiquitinated by CRL4·Cdt2 (not shown).
Fig. 5
Fig. 5
Geminin and Emi1 validate the siRNA HTS EDR assay. Geminin and Emi1 are present during S, G2 and early M phases. Geminin inhibits Cdt1, a protein essential for assembly of prereplication complexes (Fig. 1). Emi1 inhibits the anaphase promoting complex (APC), a ubiquitin ligase that targets geminin, cyclin A (CcnA), and cyclin B (CcnB) for degradation. Thus, Emi1 prevents ubiquitin-dependent degradation of geminin, CcnA and CcnB. When Emi1 is degraded during mitosis, both geminin and CcnA are ubiquitinated by the APC and then degraded. Thus, siRNA suppression of geminin induces DNA re-replication in cells that rely solely on geminin to prevent prereplication complex assembly (e.g. cancer cells), whereas siRNA suppression of Emi1 induces DNA re-replication in cells that rely on either geminin or Cdk2·CcnA to prevent assembly of prereplication complexes (normal cells as well as cancer cells).
Fig. 6
Fig. 6
HTS of small molecules and siRNAs. The EDR assay can be used in HTS of either small molecules or siRNAs. The small molecule screen was performed with 1536-well plates and seeded with 250 cells/well. Each compound was added in a spectrum of concentrations from 3 to 46 μM and cultured for 48 h. For the siRNA screen, siRNA was incubated with lipid in 384 well plates for 45 min, and then 750 cells were added to each well and transfection was allowed to proceed for 72 h. In both assays, nuclear DNA was stained with Hoechst and the DNA content of each cell in each well was quantified using either a laser scanning cytometer (shown) or an automated microscope. The fraction of cells (i.e. nuclei) with >4 N DNA content was then quantified and analyzed as described [11].
Fig. 7
Fig. 7
Detecting excess DNA replication in human cells. SW480 cells were incubated for 48 h at 37 °C and 5% CO2 in medium containing 0.4% (65 mM) DMSO alone or with 3 μM podophyllotoxin. After addition of Hoescht and incubation for 1 h at room temperature, the cells were imaged by a laser scanning cytometer. Scans of a single well from a 1536-well plate are shown for DMSO minus or plus podophyllotoxin-treated control wells. Fluorescent objects were classified and colored as follows: nuclei with ≤4 N DNA content [dark blue, 3000–50,000 fluorescence units (FLU), 40–100% Gaussian shape)], nuclei with >4 N DNA content (red, 50,000–200,000 FLU, 40–100% Gaussian shape), unrecognizable as single nuclei (cyan, 3000–200,000 FLU,<40% Gaussian shape), and excluded fluorescent objects (yellow,<3000 or >200,000 FLU). Gaussian shape refers to the fit of the intensity profile to an ideal sphere (100%). Histograms using these color classifications were constructed from 16 wells each treated with DMSO alone (−podophyllotoxin) or with 3 μM podophyllotoxin (+podophyllotoxin) to reveal the frequency of each type of object. The results are analogous to a FACS profile in which the relative numbers of cells in G1, S, and G2/M phases of the cell cycle are determined. Reproduced from [11].
Fig. 8
Fig. 8
siRNA against geminin in the HTS EDR assay. HCT116 cells were reverse transfected with either 20 nM negative control siRNA or 20 nM siRNA against geminin for 72 h. DNA was stained with Hoechst (blue) and imaged using ImageXpress. Cells with >4 N DNA content are false-colored in green.
Fig. 9
Fig. 9
Examples of quality control metrics. SSMD, Z′-factor, CV, and S/B metrics were applied to the raw data from each plate in the siRNA HTS EDR assay of the Ambion human genome library. The red lines are linear regression plots to indicate the trend. The variation of each metric from plate to plate is indicated by the range of scatter in the data for the CV (28–60), S/B (5–7), SSMD (5–14), and Z′-factor (0.4–0.8).
Fig. 10
Fig. 10
Example of robust Z scores. Data for the Ambion human genome library were normalized to their negative siRNA control. The dashed line represents the median signal for the whole screen. The red line indicates 5MAD above the median. Signals <3MAD above the median were considered negative results. Signals >3MAD but <5MAD were considered inconclusive results. Signals >5MAD were considered positive results.
Fig. 11
Fig. 11
Curve Classes. Quantitative HTS relies on measuring the activity of each compound at a broad range of concentrations. Dose response curves can be subdivided into six classes based on curve fit and response efficacy. Compounds with curve classes 1.1, 1.2, 2.1, and 2.2 are considered active. Compounds with curve class three are considered inconclusive, and those with curve class four are nonactive. Compounds that do not fall into these six classes should be retested. Taken from [35].
Fig. 12
Fig. 12
Promiscuity analysis. The activity of each of the 1191 compounds that selectively induced EDR in SW480 cells in the primary qHTS was recorded for each of the different HTS assays carried out by the NIH Chemical Genomics Center. A score of 0 indicates no activity in any of the assays, whereas a score of 10 indicates activity in all of the assays in which this compound was tested.
Fig. 13
Fig. 13
Identifying genes that prevent excess DNA replication in cancer cells. HCT116 cells were reverse transfected with 20 nM each of siRNAs representing 21,584 human genes. The data were normalized to both negative control siRNA and to the positive control siRNA against geminin. Of these, 69 genes had at least two siRNAs with a signal ≥5MAD above the median. These genes, together with an additional 84 genes whose signal was ≥3MAD above the median, but for which GeneGo identified relationships to one or more of the 69 genes selected from the primary screen, were again subjected to the same HTS assay, but using four independent siRNAs from Qiagen. Of these 153 genes, 89 had at least two siRNAs with a signal ≥5MAD above the median (panel A). The results were decidedly biphasic with Emi1, Gmnn and Top2a among the genes with the highest HTS signal and the maximum number of siRNAs per gene. The average fraction of nuclei with >4 N DNA content for each gene in panel A was determined from the 2–7 siRNAs that were ≥5MAD for each gene in panel B.

References

    1. Zhu W, Depamphilis ML. Cancer Res. 2009;69:4870–4877. - PMC - PubMed
    1. Ullah Z, Lee CY, Lilly MA, DePamphilis ML. Cell Cycle. 2009;8:1501–1509. - PMC - PubMed
    1. Ullah Z, Lee CY, Depamphilis ML. Cell Div. 2009;4:10. - PMC - PubMed
    1. Depamphilis ML, Bell SD. Genome Duplication. 1. Garland Science; London: 2010.
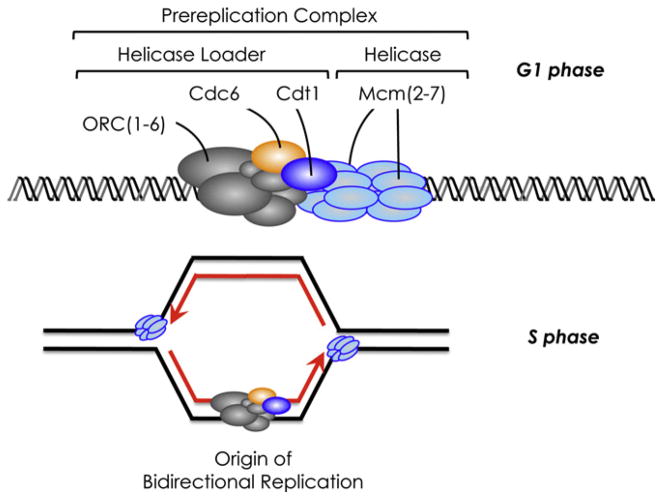
    1. Sivaprasad U, Dutta A, Bell SP. Assembly of pre-replication complexes. In: DePamphilis ML, editor. DNA Replication and Human Disease. Cold Spring Harbor Laboratory Press; Cold Spring Harbor, NY: 2006. pp. 63–88.

Publication types

Substances

LinkOut - more resources