

Common variants at 6q22 and 17q21 are associated with intracranial volume
- PMID: 22504418
- PMCID: PMC3618290
- DOI: 10.1038/ng.2245
Common variants at 6q22 and 17q21 are associated with intracranial volume
Erratum in
- Nat Genet. 2012 Jun;44(6):732
- Nat Genet. 2013 Jun;45(6):713. Sørensen, Thorkild I A [removed]
Abstract
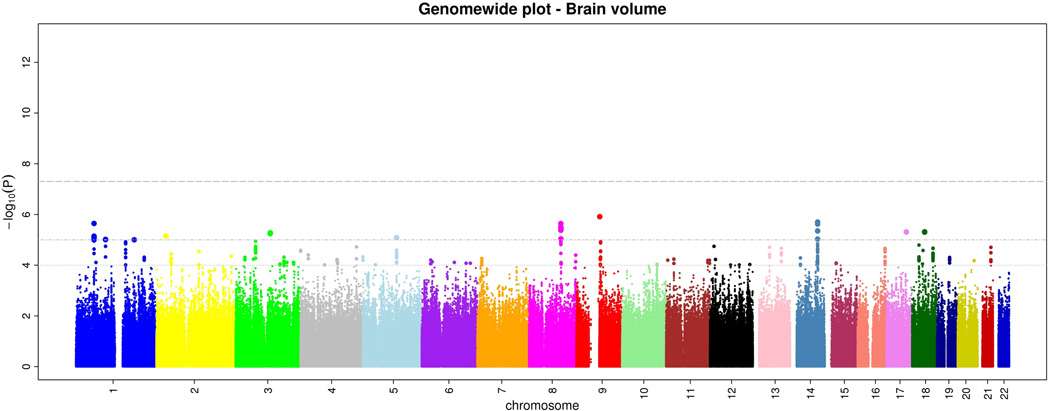
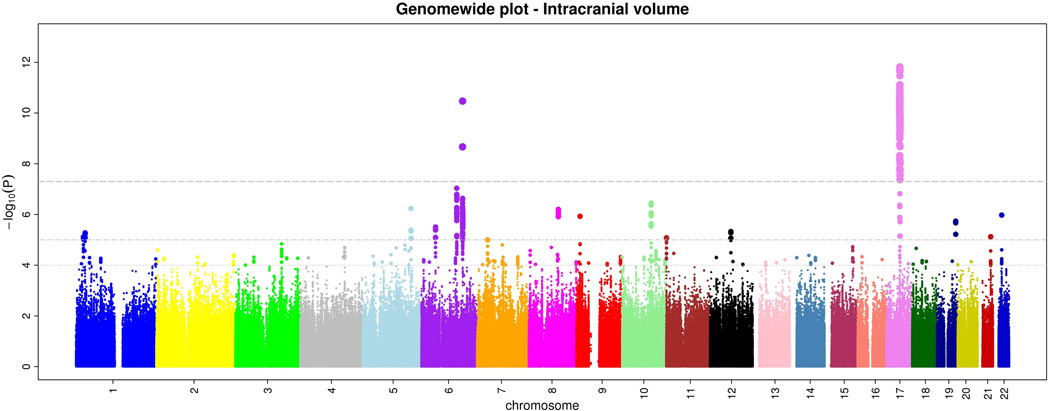
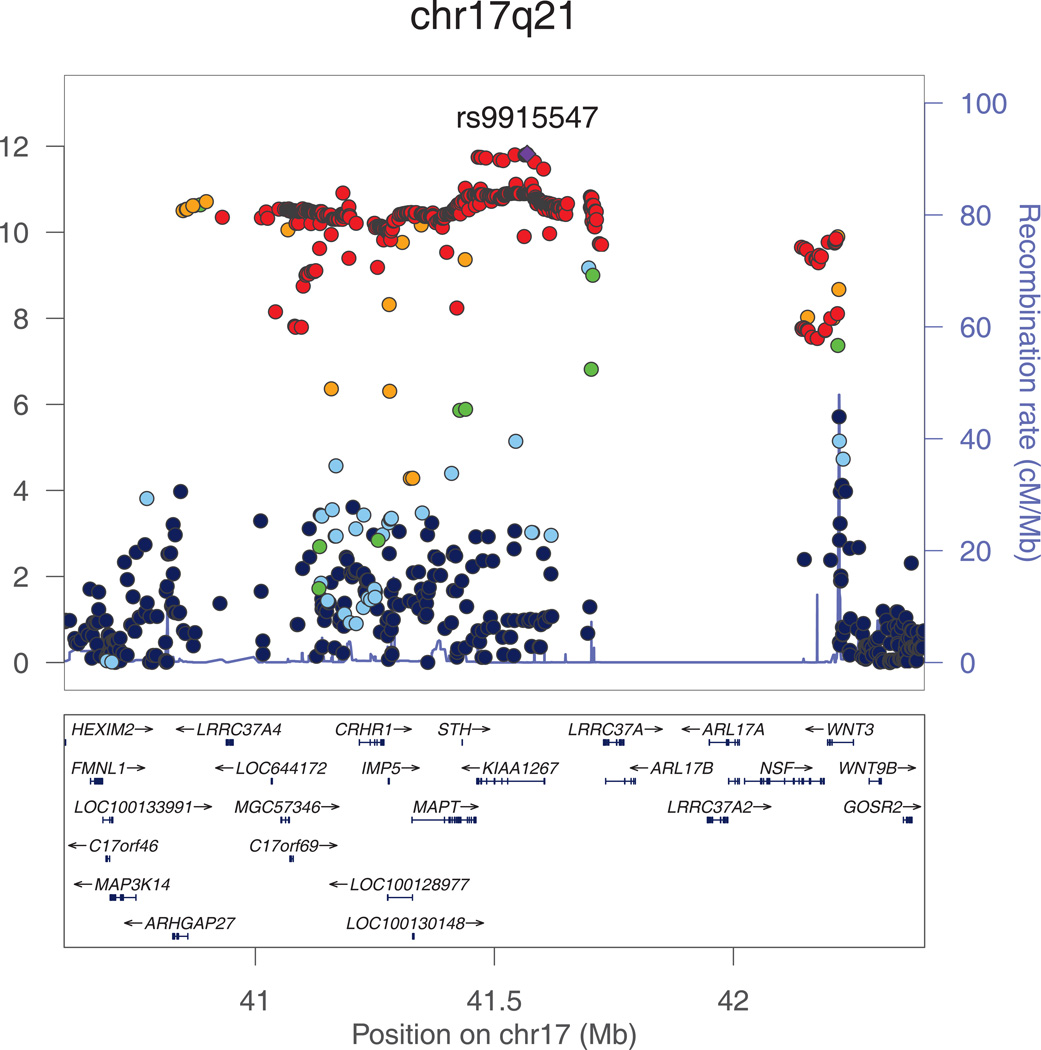
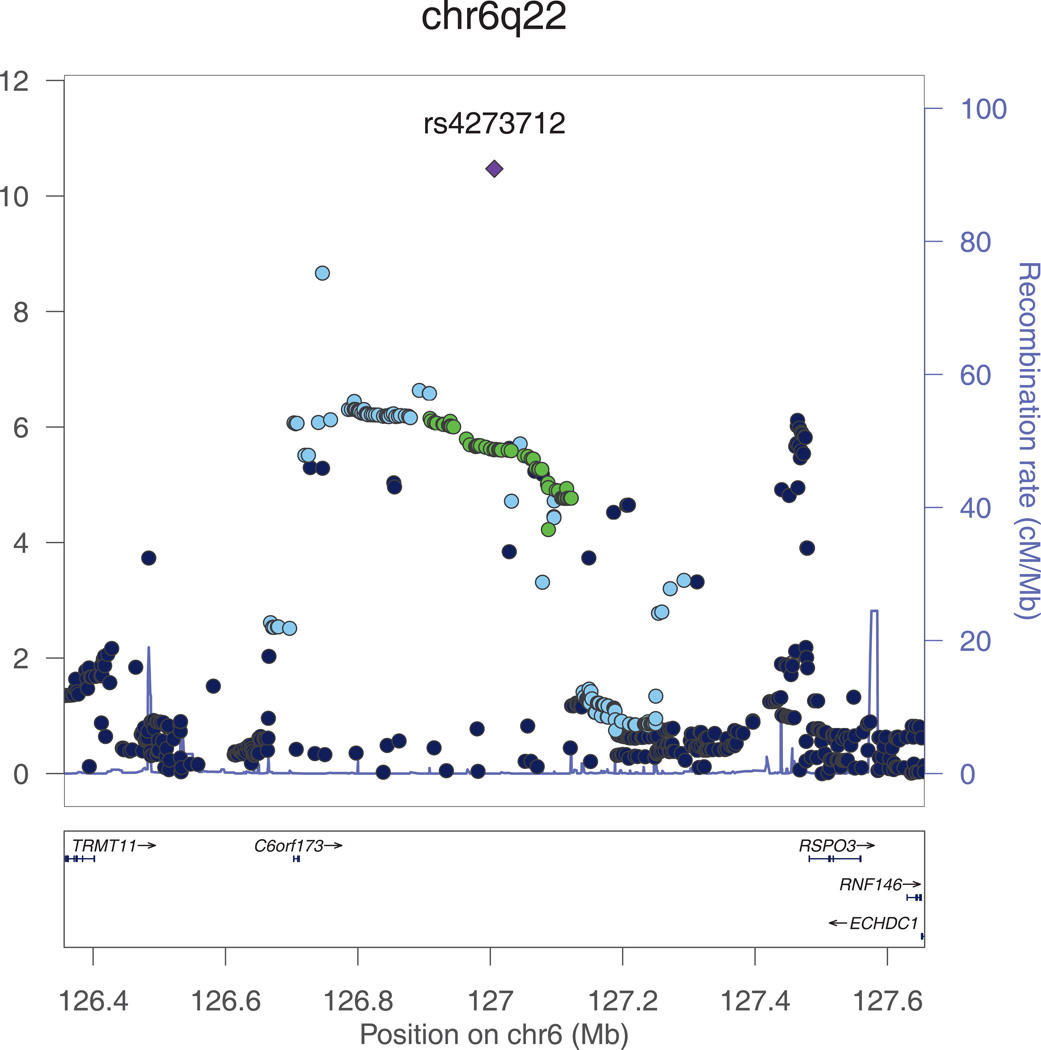
During aging, intracranial volume remains unchanged and represents maximally attained brain size, while various interacting biological phenomena lead to brain volume loss. Consequently, intracranial volume and brain volume in late life reflect different genetic influences. Our genome-wide association study (GWAS) in 8,175 community-dwelling elderly persons did not reveal any associations at genome-wide significance (P < 5 × 10(-8)) for brain volume. In contrast, intracranial volume was significantly associated with two loci: rs4273712 (P = 3.4 × 10(-11)), a known height-associated locus on chromosome 6q22, and rs9915547 (P = 1.5 × 10(-12)), localized to the inversion on chromosome 17q21. We replicated the associations of these loci with intracranial volume in a separate sample of 1,752 elderly persons (P = 1.1 × 10(-3) for 6q22 and 1.2 × 10(-3) for 17q21). Furthermore, we also found suggestive associations of the 17q21 locus with head circumference in 10,768 children (mean age of 14.5 months). Our data identify two loci associated with head size, with the inversion at 17q21 also likely to be involved in attaining maximal brain size.
Figures
References
-
- Gale CR, O'Callaghan FJ, Bredow M, Martyn CN. The influence of head growth in fetal life, infancy, and childhood on intelligence at the ages of 4 and 8 years. Pediatrics. 2006;118:1486–1492. - PubMed
-
- Gale CR, O'Callaghan FJ, Godfrey KM, Law CM, Martyn CN. Critical periods of brain growth and cognitive function in children. Brain. 2004;127:321–329. - PubMed
-
- DeCarli C, et al. Measures of brain morphology and infarction in the framingham heart study: establishing what is normal. Neurobiol Aging. 2005;26:491–510. - PubMed
-
- Ikram MA, et al. Brain tissue volumes in the general elderly population. The Rotterdam Scan Study. Neurobiol Aging. 2008;29:882–890. - PubMed
-
- Carmelli D, et al. Evidence for genetic variance in white matter hyperintensity volume in normal elderly male twins. Stroke. 1998;29:1177–1181. - PubMed
Publication types
MeSH terms
Substances
Grants and funding
- R01 NS017950/NS/NINDS NIH HHS/United States
- R01 AG016495/AG/NIA NIH HHS/United States
- N02 HL064278/HL/NHLBI NIH HHS/United States
- 1R01HD056465-01A1/HD/NICHD NIH HHS/United States
- N01 HC055020/HL/NHLBI NIH HHS/United States
- R01-HL093029/HL/NHLBI NIH HHS/United States
- AG031287/AG/NIA NIH HHS/United States
- N01 HC055016/HC/NHLBI NIH HHS/United States
- R01 AG031287/AG/NIA NIH HHS/United States
- 076467/WT_/Wellcome Trust/United Kingdom
- UL1RR025005/RR/NCRR NIH HHS/United States
- U01-HG004402/HG/NHGRI NIH HHS/United States
- AG033040/AG/NIA NIH HHS/United States
- N02-HL-6-4278/HL/NHLBI NIH HHS/United States
- N01-HC-25195/HC/NHLBI NIH HHS/United States
- N01 HC055016/HL/NHLBI NIH HHS/United States
- G0801056/MRC_/Medical Research Council/United Kingdom
- N01 AG012100/AG/NIA NIH HHS/United States
- N01 HC055019/HL/NHLBI NIH HHS/United States
- UL1 RR025005/RR/NCRR NIH HHS/United States
- R01 HL087679/HL/NHLBI NIH HHS/United States
- N01-HC-55022/HC/NHLBI NIH HHS/United States
- N01 HC055021/HL/NHLBI NIH HHS/United States
- GR069224/WT_/Wellcome Trust/United Kingdom
- N01-HC-55016/HC/NHLBI NIH HHS/United States
- P30 AG013846/AG/NIA NIH HHS/United States
- N01 HC055015/HL/NHLBI NIH HHS/United States
- AG033193/AG/NIA NIH HHS/United States
- 1RL1MH083268-01/MH/NIMH NIH HHS/United States
- N01-HC-55021/HC/NHLBI NIH HHS/United States
- U01 HG004402/HG/NHGRI NIH HHS/United States
- HL093029/HL/NHLBI NIH HHS/United States
- R01-HL087641/HL/NHLBI NIH HHS/United States
- R01 HL093029/HL/NHLBI NIH HHS/United States
- NS17950/NS/NINDS NIH HHS/United States
- R01 HL105756/HL/NHLBI NIH HHS/United States
- AG08122/AG/NIA NIH HHS/United States
- R01 AG008122/AG/NIA NIH HHS/United States
- N01-HC-55019/HC/NHLBI NIH HHS/United States
- R01 HD056465/HD/NICHD NIH HHS/United States
- N01 HC025195/HL/NHLBI NIH HHS/United States
- R01 AG033193/AG/NIA NIH HHS/United States
- N01-HC-55015/HC/NHLBI NIH HHS/United States
- P30AG013846/AG/NIA NIH HHS/United States
- 090532/WT_/Wellcome Trust/United Kingdom
- MOP 82893/CAPMC/ CIHR/Canada
- N01-HC-55020/HC/NHLBI NIH HHS/United States
- R01 AG033040/AG/NIA NIH HHS/United States
- N01 HC055018/HL/NHLBI NIH HHS/United States
- G0500539/MRC_/Medical Research Council/United Kingdom
- 74882/MRC_/Medical Research Council/United Kingdom
- AG16495/AG/NIA NIH HHS/United States
- N01 HC055022/HL/NHLBI NIH HHS/United States
- 5R01HL087679-02/HL/NHLBI NIH HHS/United States
- RL1 MH083268/MH/NIMH NIH HHS/United States
- N01-HC-55018/HC/NHLBI NIH HHS/United States
- R01 HL087641/HL/NHLBI NIH HHS/United States
LinkOut - more resources
Full Text Sources
