Meta-Analysis
. 2012 Apr 15;44(5):532-538.
doi: 10.1038/ng.2238.

Common variants at 12q15 and 12q24 are associated with infant head circumference

H Rob Taal #  1   2   3 Beate St Pourcain #  4 Elisabeth Thiering #  5 Shikta Das #  6 Dennis O Mook-Kanamori #  1   2   3   7 Nicole M Warrington  8   9 Marika Kaakinen  10   11 Eskil Kreiner-Møller  12 Jonathan P Bradfield  13 Rachel M Freathy  14 Frank Geller  15 Mònica Guxens  16   17   18 Diana L Cousminer  19 Marjan Kerkhof  20 Nicholas J Timpson  4 M Arfan Ikram  1   21 Lawrence J Beilin  22 Klaus Bønnelykke  12 Jessica L Buxton  23 Pimphen Charoen  6   24 Bo Lund Krogsgaard Chawes  12 Johan Eriksson  25   26   27 David M Evans  4 Albert Hofman  1   3 John P Kemp  4 Cecilia E Kim  13 Norman Klopp  28   29 Jari Lahti  30 Stephen J Lye  9 George McMahon  4 Frank D Mentch  13 Martina Müller  31   32   33 Paul F O'Reilly  34 Inga Prokopenko  35   36 Fernando Rivadeneira  1   37 Eric A P Steegers  38 Jordi Sunyer  16   17   18   39 Carla Tiesler  5   40 Hanieh Yaghootkar  14 Cohorts for Heart and Aging Research in Genetic Epidemiology (CHARGE) ConsortiumMonique M B Breteler  1 Stephanie Debette  41 Myriam Fornage  42 Vilmundur Gudnason  43   44 Lenore J Launer  45 Aad van der Lugt  21 Thomas H Mosley  46 Sudha Seshadri  41 Albert V Smith  43   44 Meike W Vernooij  1   21 Early Genetics & Lifecourse Epidemiology (EAGLE) consortiumAlexandra If Blakemore  23 Rosetta M Chiavacci  13 Bjarke Feenstra  15 Julio Fernandez-Benet  47 Struan F A Grant  13   48   49 Anna-Liisa Hartikainen  50 Albert J van der Heijden  2 Carmen Iñiguez  18   51 Mark Lathrop  52   53 Wendy L McArdle  54 Anne Mølgaard  12 John P Newnham  8 Lyle J Palmer  9   55 Aarno Palotie  19   56   57   58 Annneli Pouta  59 Susan M Ring  54 Ulla Sovio  6   60 Marie Standl  5 Andre G Uitterlinden  1   37 H-Erich Wichmann  5   31   33 Nadja Hawwa Vissing  12 Charles DeCarli  61 Cornelia M van Duijn  1 Mark I McCarthy  35   36   62 Gerard H Koppelman  63 Xavier Estivill  18   39   64 Andrew T Hattersley  65 Mads Melbye  15 Hans Bisgaard  12 Craig E Pennell  8 Elisabeth Widen  19 Hakon Hakonarson  13   48   49 George Davey Smith  4 Joachim Heinrich  5 Marjo-Riitta Jarvelin  10   59   66 Early Growth Genetics (EGG) ConsortiumVincent W V Jaddoe  1   2   3
Collaborators, Affiliations
Meta-Analysis

Common variants at 12q15 and 12q24 are associated with infant head circumference

H Rob Taal et al. Nat Genet. .

Erratum in

  • Nat Genet. 2013 June;45(6):713. Sørensen, Thorkild I A [removed]

Abstract

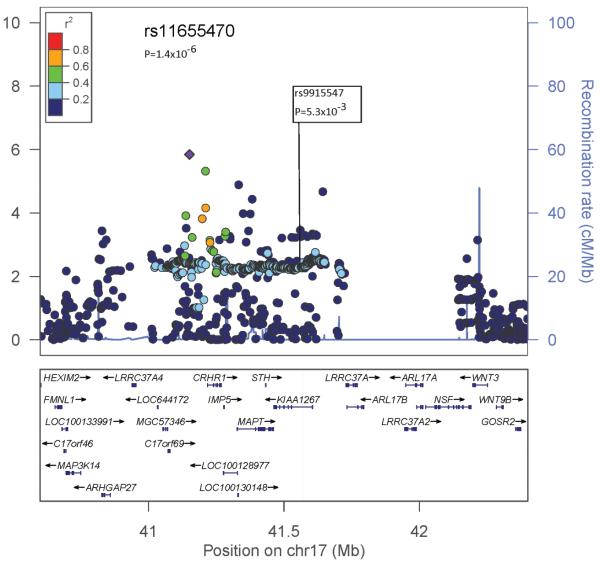
To identify genetic variants associated with head circumference in infancy, we performed a meta-analysis of seven genome-wide association studies (GWAS) (N = 10,768 individuals of European ancestry enrolled in pregnancy and/or birth cohorts) and followed up three lead signals in six replication studies (combined N = 19,089). rs7980687 on chromosome 12q24 (P = 8.1 × 10(-9)) and rs1042725 on chromosome 12q15 (P = 2.8 × 10(-10)) were robustly associated with head circumference in infancy. Although these loci have previously been associated with adult height, their effects on infant head circumference were largely independent of height (P = 3.8 × 10(-7) for rs7980687 and P = 1.3 × 10(-7) for rs1042725 after adjustment for infant height). A third signal, rs11655470 on chromosome 17q21, showed suggestive evidence of association with head circumference (P = 3.9 × 10(-6)). SNPs correlated to the 17q21 signal have shown genome-wide association with adult intracranial volume, Parkinson's disease and other neurodegenerative diseases, indicating that a common genetic variant in this region might link early brain growth with neurological disease in later life.


Figures

Figure 1
Figure 1
Directly genotyped and imputed SNPs are plotted using filled circles with their meta-analysis P values (as −log10 values) as a function of genomic position (NCBI Build 36). In each plot, the discovery-stage SNP taken forward to replication stage is represented by a purple diamond (defining a global meta-analysis P value). Local LD structure is reflected by the plotted estimated recombination rates (taken from HapMap) in the region around the associated SNPs and their correlated proxies. The correlations of the lead SNP to other SNPs at the locus are shown on a color scale from r2<0.2 dark blue; 0.2=<r2<0.4 light-blue; 0.4=<r2<0.6 green; 0.6=<r2<0.8 orange; r2>=0.8 red. Superimposed on the plot are the recombination rates (light blue line, second y axis). Gene annotations are shown as the dark blue arrows. The regional plots were drawn using the LocusZoom software. 1a Regional plot of locus 12q24.31 1b Regional plot of locus 12q15 1c Regional association plot of locus 17q21.1; downstream of the lead signal, rs9915547 is indicated (r2 0.22 HapMap CEU with rs11655470), which showed a genome wide significant association with adult intra cranial volume (P=1.5×10⁻¹²) as described in Ikram et al.
Figure 1
Figure 1
Directly genotyped and imputed SNPs are plotted using filled circles with their meta-analysis P values (as −log10 values) as a function of genomic position (NCBI Build 36). In each plot, the discovery-stage SNP taken forward to replication stage is represented by a purple diamond (defining a global meta-analysis P value). Local LD structure is reflected by the plotted estimated recombination rates (taken from HapMap) in the region around the associated SNPs and their correlated proxies. The correlations of the lead SNP to other SNPs at the locus are shown on a color scale from r2<0.2 dark blue; 0.2=<r2<0.4 light-blue; 0.4=<r2<0.6 green; 0.6=<r2<0.8 orange; r2>=0.8 red. Superimposed on the plot are the recombination rates (light blue line, second y axis). Gene annotations are shown as the dark blue arrows. The regional plots were drawn using the LocusZoom software. 1a Regional plot of locus 12q24.31 1b Regional plot of locus 12q15 1c Regional association plot of locus 17q21.1; downstream of the lead signal, rs9915547 is indicated (r2 0.22 HapMap CEU with rs11655470), which showed a genome wide significant association with adult intra cranial volume (P=1.5×10⁻¹²) as described in Ikram et al.

References

    1. Lango Allen H, et al. Hundreds of variants clustered in genomic loci and biological pathways affect human height. Nature. 2010;467:832–8. - PMC - PubMed
    1. Ikram MA, et al. Common variants at 6q22 and 17q21 are associated with intracranial volume. Nat Genet. 2012 advance online publication. - PMC - PubMed
    1. Simon-Sanchez J, et al. Genome-wide association study reveals genetic risk underlying Parkinson’s disease. Nat Genet. 2009;41:1308–12. - PMC - PubMed
    1. International Parkinson Disease Genomics, C et al. Imputation of sequence variants for identification of genetic risks for Parkinson’s disease: a meta-analysis of genome-wide association studies. Lancet. 2011;377:641–9. - PMC - PubMed
    1. Webb A, et al. Role of the tau gene region chromosome inversion in progressive supranuclear palsy, corticobasal degeneration, and related disorders. Arch Neurol. 2008;65:1473–8. - PMC - PubMed

Publication types

Substances