

Genome-wide meta-analysis identifies 56 bone mineral density loci and reveals 14 loci associated with risk of fracture
- PMID: 22504420
- PMCID: PMC3338864
- DOI: 10.1038/ng.2249
Genome-wide meta-analysis identifies 56 bone mineral density loci and reveals 14 loci associated with risk of fracture
Abstract
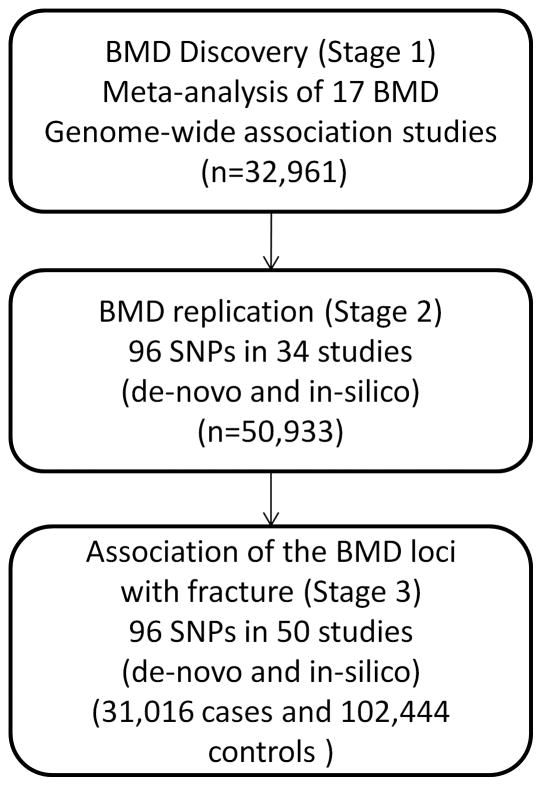
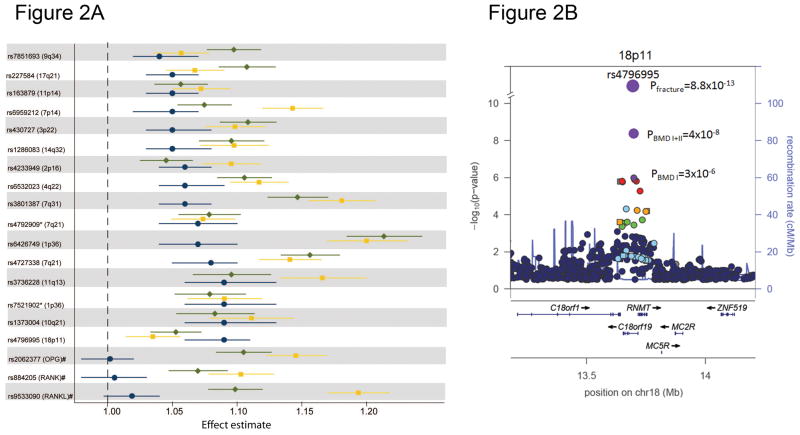
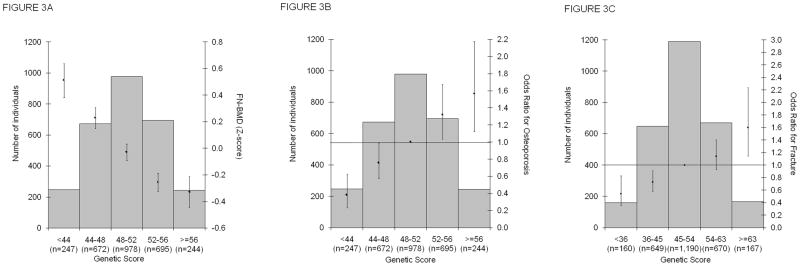
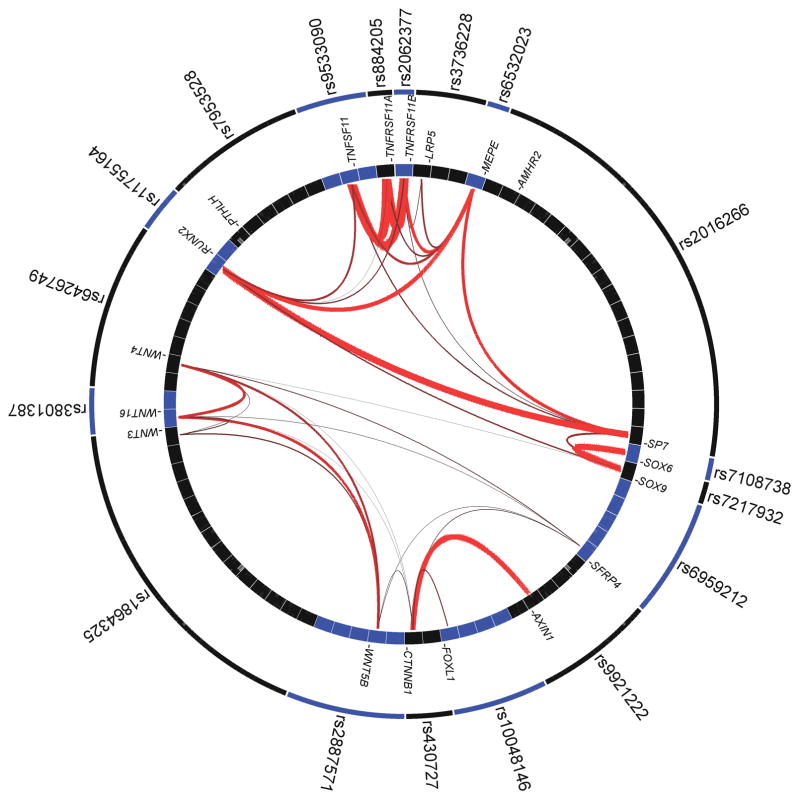
Bone mineral density (BMD) is the most widely used predictor of fracture risk. We performed the largest meta-analysis to date on lumbar spine and femoral neck BMD, including 17 genome-wide association studies and 32,961 individuals of European and east Asian ancestry. We tested the top BMD-associated markers for replication in 50,933 independent subjects and for association with risk of low-trauma fracture in 31,016 individuals with a history of fracture (cases) and 102,444 controls. We identified 56 loci (32 new) associated with BMD at genome-wide significance (P < 5 × 10(-8)). Several of these factors cluster within the RANK-RANKL-OPG, mesenchymal stem cell differentiation, endochondral ossification and Wnt signaling pathways. However, we also discovered loci that were localized to genes not known to have a role in bone biology. Fourteen BMD-associated loci were also associated with fracture risk (P < 5 × 10(-4), Bonferroni corrected), of which six reached P < 5 × 10(-8), including at 18p11.21 (FAM210A), 7q21.3 (SLC25A13), 11q13.2 (LRP5), 4q22.1 (MEPE), 2p16.2 (SPTBN1) and 10q21.1 (DKK1). These findings shed light on the genetic architecture and pathophysiological mechanisms underlying BMD variation and fracture susceptibility.
Figures
References
-
- Burge R, et al. Incidence and economic burden of osteoporosis-related fractures in the United States, 2005–2025. J Bone Miner Res. 2007;22:465–75. - PubMed
-
- Johnell O, et al. Predictive value of BMD for hip and other fractures. J Bone Miner Res. 2005;20:1185–94. - PubMed
-
- Kanis JA, et al. The use of clinical risk factors enhances the performance of BMD in the prediction of hip and osteoporotic fractures in men and women. Osteoporos Int. 2007;18:1033–46. - PubMed
-
- Peacock M, Turner CH, Econs MJ, Foroud T. Genetics of osteoporosis. Endocr Rev. 2002;23:303–26. - PubMed
-
- Ralston SH, Uitterlinden AG. Genetics of osteoporosis. Endocr Rev. 2010;31:629–62. - PubMed
Publication types
MeSH terms
Substances
Grants and funding
- N01 AG012100/AG/NIA NIH HHS/United States
- G0600705/MRC_/Medical Research Council/United Kingdom
- R01 HL043851/HL/NHLBI NIH HHS/United States
- N01 HC085085/HC/NHLBI NIH HHS/United States
- U01 HL084756/HL/NHLBI NIH HHS/United States
- DK063491/DK/NIDDK NIH HHS/United States
- HL080295/HL/NHLBI NIH HHS/United States
- N01 HC085081/HL/NHLBI NIH HHS/United States
- M01-RR00425/RR/NCRR NIH HHS/United States
- CZB/4/710/CSO_/Chief Scientist Office/United Kingdom
- 254627/MRC_/Medical Research Council/United Kingdom
- N01 HC085080/HL/NHLBI NIH HHS/United States
- N01 HC-55222,/HC/NHLBI NIH HHS/United States
- P01 AG-18397/AG/NIA NIH HHS/United States
- R01 HL075366/HL/NHLBI NIH HHS/United States
- 15389/ARC_/Arthritis Research UK/United Kingdom
- R01 AR046838/AR/NIAMS NIH HHS/United States
- R01 AG015928/AG/NIA NIH HHS/United States
- N01 AG062101/AG/NIA NIH HHS/United States
- U01 HL080295/HL/NHLBI NIH HHS/United States
- HL 043851/HL/NHLBI NIH HHS/United States
- N02 HL064278/HL/NHLBI NIH HHS/United States
- P30 CA015704/CA/NCI NIH HHS/United States
- N01 HC085082/HL/NHLBI NIH HHS/United States
- N01 HC075150/HC/NHLBI NIH HHS/United States
- HL69757/HL/NHLBI NIH HHS/United States
- 1R01AG032098/AG/NIA NIH HHS/United States
- HL105756/HL/NHLBI NIH HHS/United States
- N01 HC015103/HC/NHLBI NIH HHS/United States
- N01 HC085086/HL/NHLBI NIH HHS/United States
- N01 HC085083/HL/NHLBI NIH HHS/United States
- RG/08/014/24067/BHF_/British Heart Foundation/United Kingdom
- R56 AG020098/AG/NIA NIH HHS/United States
- 17539/ARC_/Arthritis Research UK/United Kingdom
- N01 HC025195/HC/NHLBI NIH HHS/United States
- R01 AG18728/AG/NIA NIH HHS/United States
- G1000143/MRC_/Medical Research Council/United Kingdom
- T32 AG000262/AG/NIA NIH HHS/United States
- M01 RR-00750/RR/NCRR NIH HHS/United States
- R01 HL087652/HL/NHLBI NIH HHS/United States
- R01 AR/AG 41398/AG/NIA NIH HHS/United States
- AG-20098/AG/NIA NIH HHS/United States
- HL087652/HL/NHLBI NIH HHS/United States
- UL1 TR000124/TR/NCATS NIH HHS/United States
- N01 AG062106/AG/NIA NIH HHS/United States
- N01-HC-85086/HC/NHLBI NIH HHS/United States
- R01 AR041398/AR/NIAMS NIH HHS/United States
- R01 AG041517/AG/NIA NIH HHS/United States
- R01 HL105756/HL/NHLBI NIH HHS/United States
- P01 AG018397/AG/NIA NIH HHS/United States
- M01 RR000750/RR/NCRR NIH HHS/United States
- MC_UP_A620_1014/MRC_/Medical Research Council/United Kingdom
- R01 AG032098/AG/NIA NIH HHS/United States
- CA 047988/CA/NCI NIH HHS/United States
- AG-027058/AG/NIA NIH HHS/United States
- P30 DK063491/DK/NIDDK NIH HHS/United States
- HHSN268200782096C/HG/NHGRI NIH HHS/United States
- HL075366/HL/NHLBI NIH HHS/United States
- P30 DK072488/DK/NIDDK NIH HHS/United States
- N01 HC025195/HL/NHLBI NIH HHS/United States
- N01 HC055222/HL/NHLBI NIH HHS/United States
- N01 AG062103/AG/NIA NIH HHS/United States
- G0401527/MRC_/Medical Research Council/United Kingdom
- G0800582/MRC_/Medical Research Council/United Kingdom
- R01AR046838/AR/NIAMS NIH HHS/United States
- N01 HC085079/HL/NHLBI NIH HHS/United States
- N01-HC-75150/HC/NHLBI NIH HHS/United States
- MC_PC_U127561128/MRC_/Medical Research Council/United Kingdom
- R01 HL080295/HL/NHLBI NIH HHS/United States
- ImNIH/Intramural NIH HHS/United States
- R01 CA047988/CA/NCI NIH HHS/United States
- M01 RR000425/RR/NCRR NIH HHS/United States
- N01 HC085084/HC/NHLBI NIH HHS/United States
- R01 AG020098/AG/NIA NIH HHS/United States
- U19 HL069757/HL/NHLBI NIH HHS/United States
- N01-HC-85079/HC/NHLBI NIH HHS/United States
- WT_/Wellcome Trust/United Kingdom
- K08 AR055688/AR/NIAMS NIH HHS/United States
- N01-HC-85239/HC/NHLBI NIH HHS/United States
- AG-023629/AG/NIA NIH HHS/United States
- F32 AR059469/AR/NIAMS NIH HHS/United States
- N01 HC075150/HL/NHLBI NIH HHS/United States
- R01 AR050066/AR/NIAMS NIH HHS/United States
- R01 AG023629/AG/NIA NIH HHS/United States
- 572604/MRC_/Medical Research Council/United Kingdom
- R01 AG027058/AG/NIA NIH HHS/United States
- N01 HC045133/HC/NHLBI NIH HHS/United States
- MC_U147585824/MRC_/Medical Research Council/United Kingdom
- U01 HL069757/HL/NHLBI NIH HHS/United States
- R01 AG018728/AG/NIA NIH HHS/United States
- G9800062/MRC_/Medical Research Council/United Kingdom
- N01 HC035129/HC/NHLBI NIH HHS/United States
- R01 AR 050066/AR/NIAMS NIH HHS/United States
- R56 AG023629/AG/NIA NIH HHS/United States
- G9321536/MRC_/Medical Research Council/United Kingdom
- 303169/MRC_/Medical Research Council/United Kingdom
- R01 HL088119/HL/NHLBI NIH HHS/United States
- 86748/CAPMC/ CIHR/Canada
LinkOut - more resources
Full Text Sources
Other Literature Sources
Medical
Miscellaneous
