. 2012 Apr 15;18(5):774-82.
doi: 10.1038/nm.2728.

Adora2b-elicited Per2 stabilization promotes a HIF-dependent metabolic switch crucial for myocardial adaptation to ischemia

Affiliations

Adora2b-elicited Per2 stabilization promotes a HIF-dependent metabolic switch crucial for myocardial adaptation to ischemia

Tobias Eckle et al. Nat Med. .

Abstract

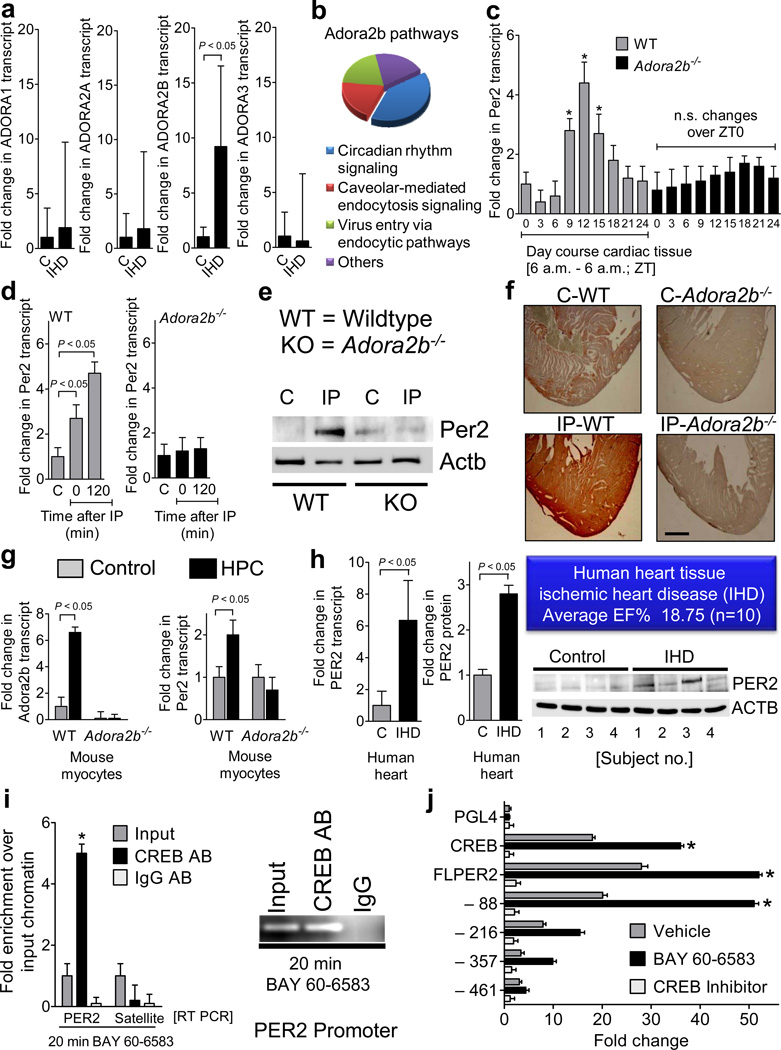
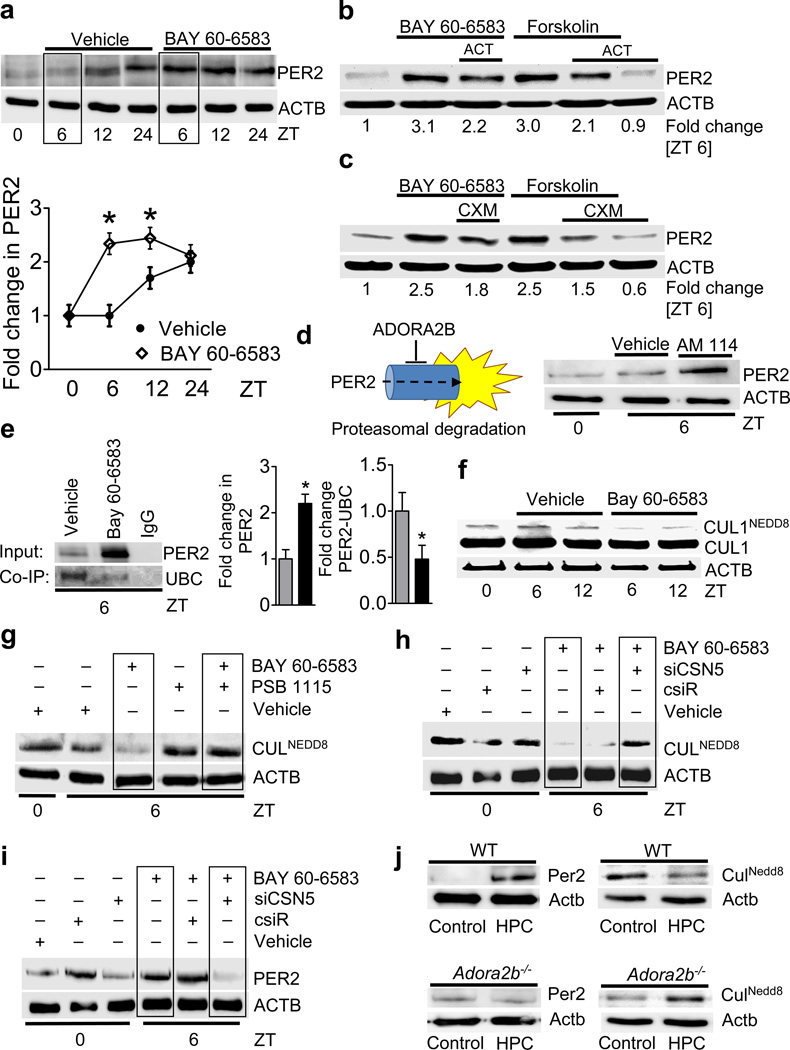
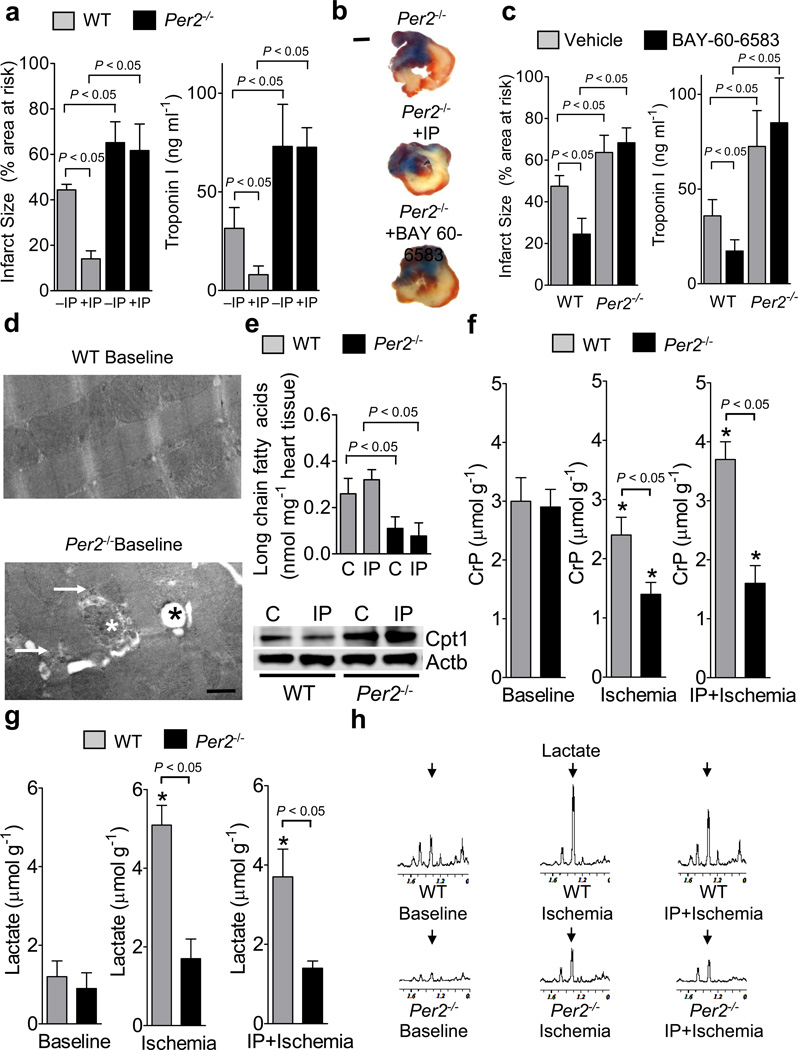
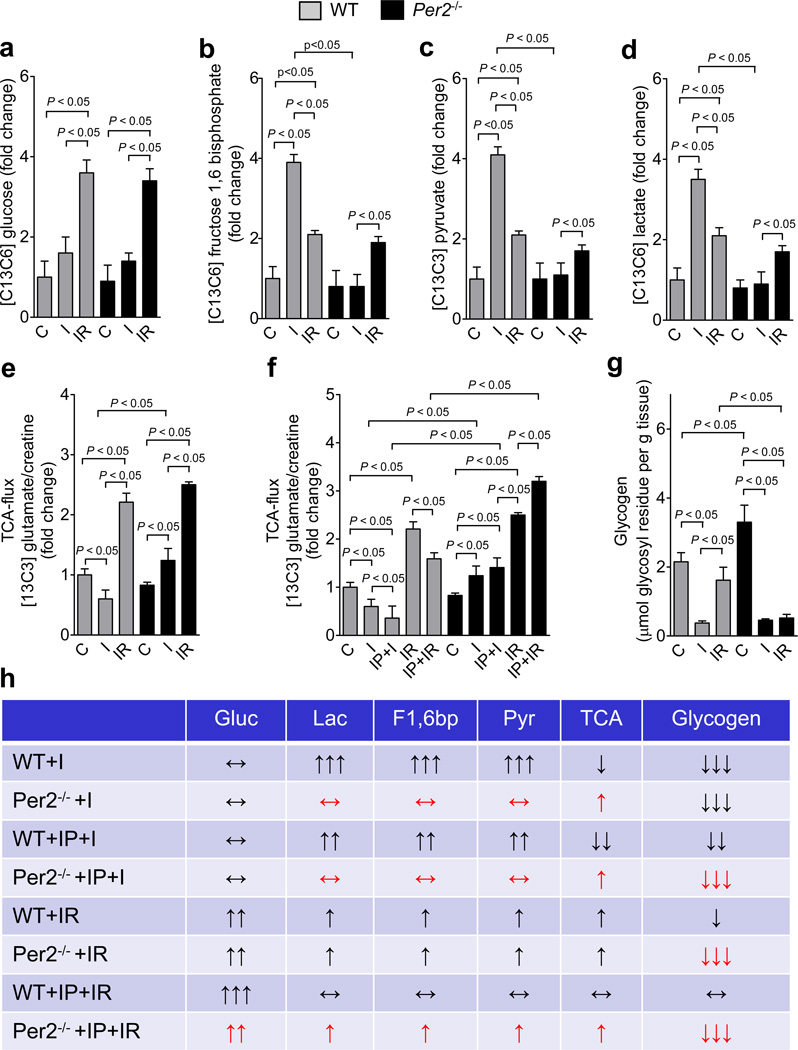
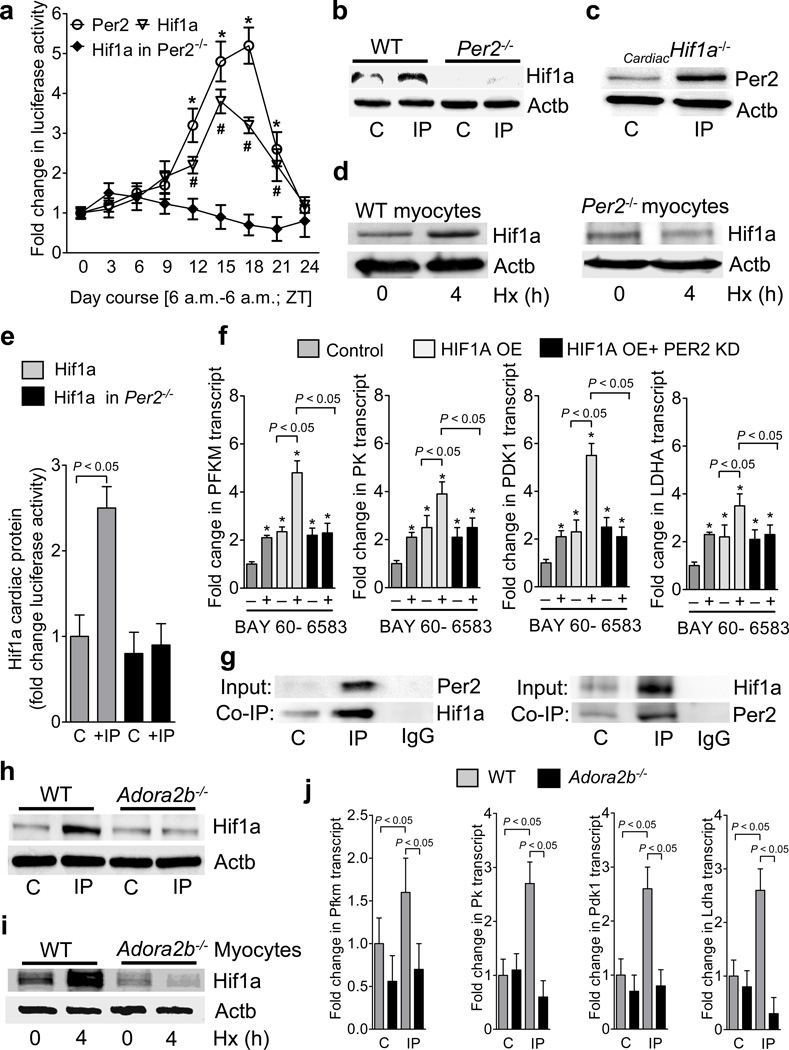
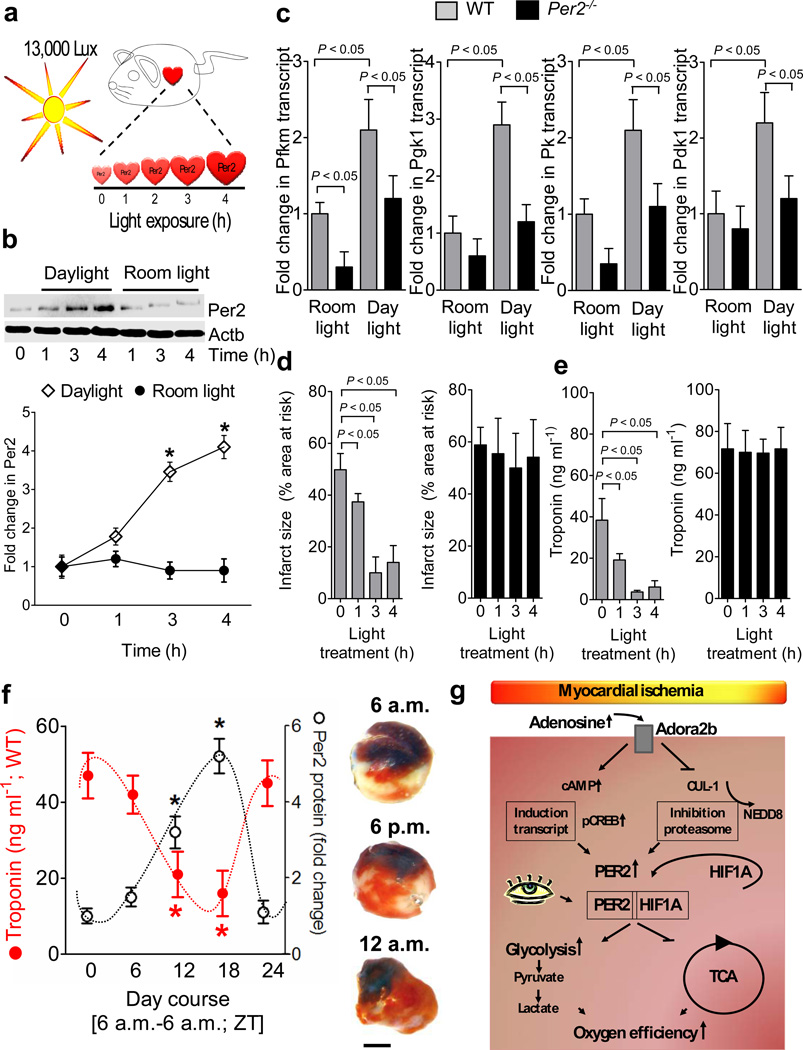
Adenosine signaling has been implicated in cardiac adaptation to limited oxygen availability. In a wide search for adenosine receptor A2b (Adora2b)-elicited cardioadaptive responses, we identified the circadian rhythm protein period 2 (Per2) as an Adora2b target. Adora2b signaling led to Per2 stabilization during myocardial ischemia, and in this setting, Per2(-/-) mice had larger infarct sizes compared to wild-type mice and loss of the cardioprotection conferred by ischemic preconditioning. Metabolic studies uncovered a limited ability of ischemic hearts in Per2(-/-) mice to use carbohydrates for oxygen-efficient glycolysis. This impairment was caused by a failure to stabilize hypoxia-inducible factor-1α (Hif-1α). Moreover, stabilization of Per2 in the heart by exposing mice to intense light resulted in the transcriptional induction of glycolytic enzymes and Per2-dependent cardioprotection from ischemia. Together, these studies identify adenosine-elicited stabilization of Per2 in the control of HIF-dependent cardiac metabolism and ischemia tolerance and implicate Per2 stabilization as a potential new strategy for treating myocardial ischemia.


Figures

Figure 1
Figure 1. Consequences of adenosine signaling on Period 2 induction
(a) Transcript levels of individual adenosine receptors (ADORA1 ADORA2A, ADORA2B, or ADORA3) in cardiac tissue from patients with severe ischemic heart disease (IHD) or controls (C; mean±SD, n=10 patients per condition). (b) Canonical pathway analysis. Wild-type mice or gene-targeted mice for the Adora2b (Adora2b−/−) were exposed to ischemic preconditioning (4 cycles consistent of 5min ischemia followed by 5 min of reperfusion). Following two hours of reperfusion, cardiac tissues from preconditioned myocardium were compared to control cardiac tissues without preconditioning. (c–f) Hearts from Adora2b−/− or littermate control mice matched in age, gender and weight were analyzed for diurnal variations of Per2 (c) or subjected to in situ preconditioning with 4 cycles of IP (5 minutes of ischemia, 5 minutes of reperfusion), followed by indicated time periods of reperfusion (d–f). (c, d) Per2 transcript levels (mean±SD, n=6). (e) Per2 protein levels determined by Western blot following IP-treatment without reperfusion (IP0). One representative blot of three is displayed. (f) Comparison of immunoreactivity for Per2 on pre-conditioned (IP) cardiac tissue or sham operated controls (magnification × 20, one of three representative images is displayed, scale bar represents 100 µm). (g) Adora2b or Per2 transcript level in isolated adult murine cardiomyocytes from wild-type or Adora2b−/− mice following in vitro exposure to hypoxic preconditioning (HPC; see also Supplementary Fig. S8, mean±SD, n=6). (h) PER2 transcript (left) or protein (middle, right) levels in cardiac tissues from human patients with severe ischemic heart (IHD) disease or controls (C) (see also Supplementary Fig. S4 and Supplementary Table S1; mean±SD, n=10 patients per condition). (i) Chromatin immunopreciptitation using human endothelia (HMEC-1). Following synchronization by serum starvation, human endothelia (HMEC-1) were treated with the ADORA2B agonist BAY 60-6583 for 20 minutes. Real-time RT PCR for human PER2 promoter or Satellite DNA (negative control) was performed (left). Products obtained by PER2 promoter PCR were also analyzed by using an 1% agarose gel (right; mean±SD, n=3, *p<0.05). (k) Full length PER2 promoter constructs and indicated truncations were sub-cloned into the pGL4 luciferase reporter vector. To measure promoter activity, cells were treated with BAY 60-6583 for 6 h. To control for circadian activity, cells were co-transfected with the CREB dominant negative vector from Clontech (CREB inhibitor; *significant increase of luciferase activity over baseline activity, p<0.05, n=6). Schematic of plasmids expressing sequence corresponding to full length PER2 promoter (FLPER2) or indicated truncations: −88, −216, −357,−461 with putative CREB binding sites are shown in Supplementary Fig. S11.
Figure 2
Figure 2. Influence of transcriptional, translational or post-translational mechanisms on Period 2 protein levels
(a) Synchronized HMEC-1 were treated with vehicle, or ADORA2B agonist BAY 60-6583 and blotted after indicated time periods; one of three representative experiments is displayed, and quantified below (*p<0.05, n=3). (b,c) Synchronized HMEC-1 treated with ADORA2B agonist (10mM) or forskolin (30mM) with and without actinomycin (ACT, 2µM, b) or cycloheximide (CXM, 40 µg/ml, c). Effectiveness of ACT or CXM are shown in Supplementary Fig S12 a,b. (d, left) Proposed model of adenosine-dependent alteration in post-translational PER2 protein stability; ADORA2B: A2B adenosine receptor. (d, right) PER2 protein levels following inhibition of proteasomal degradation (AM114 (10 µM; one of three representative blots is displayed). (e) Synchronized HMEC-1 were treated with vehicle, or ADORA2B agonist BAY 60-6583 and protein lysates were isolated for native protein complexes using a PER2 antibody covalently coupled (immobilized) onto an amine-reactive resin. Immunoprecipitated protein was analyzed using immunoblot against ubiquitin. One representative blot of three is displayed. (e, middle, right) Changes in protein shown by densitometry (n=3). (f) Synchronized HMEC-1 treated with vehicle, or ADORA2B agonist BAY 60-6583 and blotted for total CUL1 or neddylated CUL1 using a specific CUL1 antibody on a gradient gel. (g) HMEC-1 at 6h following synchronization treated with ADORA2B agonist BAY 60-6583 alone (10 µM), or following additional pre-treatment with ADORA2B antagonist PSB 1115 (1 µM) and blotted for neddylated CULLIN using a NEDD8 antibody (one of three representative experiments is displayed). (h, i) HMEC-1 following siRNA repression of CSN5 (siCSN5) or treatment with non-specific control siRNA (csiR) were synchronized by serum starvation, lysed and blotted for neddylated CULLIN (h) or PER2 (i) at indicated time points (one of three representative experiments is displayed). (j) Cardiac myocytes were isolated from wild-type (WT) or Adora2b−/− mice, exposed to hypoxic preconditioning (HPC) or control conditions and blotted for Per2 or neddylated Cullin (one representative blot of three independent experiments is displayed, one animal per experiment).
Figure 3
Figure 3. Functional role of Period 2 during myocardial ischemia and ischemic preconditioning
(a–c) Per2−/− mice or littermate controls matched in age, weight and gender were exposed to 60 min of in situ myocardial ischemia followed by 2h or reperfusion, or received IP pretreatment or Adora2b agonist (BAY 60-6583) treatment prior to myocardial ischemia. IP consisted of 4 cycles of 5 minutes of myocardial ischemia and 5 minutes of reperfusion. Infarct sizes are expressed as the percent of the area at risk that was exposed to myocardial ischemia. In parallel, measurements of the myocardial injury marker troponin I were performed (mean±SD; n=6). (b) Representative infarct staining from Per2−/− mice exposed to 60 min of ischemia, and 2h reperfusion alone (−IP), or additional IP or Adora2b agonist treatment (+IP/BAY 60-6583,c) are displayed (blue indicates retrograde Evan’s blue staining; red and white: area at risk; white: infarcted tissue; scale bar represents 50 µm). (d) Electron microscopy from wildtype and Per2−/− heart tissue. Baseline wildtype and Per2−/− mice showed normal sarcolemal structures, however, in some areas Per2−/− mice exhibited enhanced glycogen content (white arrow), swollen mitochondria (white star) and lipid accumulation within mitochondria (black star); scale bar represents 500 nm. (e) Per2−/− mice or littermate controls matched in age, weight and gender were subjected to in situ IP treatment consisting of 4 cycles of IP (5 minutes of ischemia, 5 minutes of reperfusion). Cardiac preconditioned tissue was shock-frozen and analyzed for long chain fatty acids using an enzymatic ELISA KIT from Biovision (mean±SD; n=3) and protein levels of carnitine-palmitoyltransferase 1 (Cpt1). One representative blot of three is displayed. (f–h) Per2−/− mice or littermate controls matched in age, weight and gender were exposed to 60 min of in situ myocardial ischemia with or without ischemic preconditioning (IP; 4 cycles of 5 min ischemia followed by 5 min of reperfusion) prior to myocardial ischemia. For nuclear magnetic resonance (NMR) analysis of cardiac metabolites, cardiac tissue was shock frozen immediately after ischemia. (f) Creatinephosphate (CrP) levels in wildtype and Per2−/− mice using NMR. Note: IP mediated conservation of CrP storage is abolished in Per2−/− mice. (g, h) Lactate levels and corresponding NMR spectra. (n=3, * significant changes compared to baseline conditions, p<0.05).
Figure 4
Figure 4. Consequences of Period 2 deficiency on cardiac metabolism during myocardial ischemia and reperfusion
(a–h) Per2−/− mice or littermate controls matched in age, weight and gender were exposed to 60 min of in situ myocardial ischemia with or without ischemic preconditioning (IP; 4 cycles of 5 min ischemia followed by 5 min of reperfusion) prior to myocardial ischemia. 13C glucose (Cambridge Isotopes) was administered intra- arterially in Per2−/− mice or littermate controls either 30 minutes before ischemia (ischemia group: I) or at the onset of reperfusion following 60 min of in situ myocardial ischemia (reperfusion group: R) with or without ischemic preconditioning (IP; 4 cycles of 5 min ischemia followed by 5 min of reperfusion). Determination of 13C glucose and 13C carbohydrates during ischemia or reperfusion was performed using liquid chromatography–tandem mass spectrometry (LC-MS). Glycogen was determined using an enzymatic ELISA KIT from Biovision (mean±SD; n=3). (a) 13C glucose. (b) 13C fructose 1,6 bisphosphate. (c) 13C pyruvate. (d) 13C lactate. (e,f) (TCA cycle) flux rates determined by the ratio of 13C glutamate and total creatine. (g) Glycogen; (mean±SD; n=3).
Figure 5
Figure 5. Hif1a as link between adenosine mediated period 2 signaling and metabolism
(a) Hearts from Hif1a reporter, Per2 reporter or Per2−/−-Hif1a reporter double mutant mice were analyzed for Hif1a or Per2 protein during a 24 h zeitgeber period (*,# p<0.05 over baseline, n=3). (b,c) Per2−/− or cardiac specific Hif1a−/− mice were subjected to IP (IP; 4 cycles of 5 min ischemia followed by 5 min of reperfusion) and Western blot analysis for Hif1a or Per2 protein from the area at risk was performed, respectively. One representative blot of three is displayed. (d) Isolated adult cardiomyocytes from wild-type or Per2−/− mice were exposed to ambient hypoxia [1%, 4h] and analyzed for Hif1a protein. One representative blot of three is displayed. (e) Hif1a reporter or Per2−/−-Hif1a reporter double mutant mice were exposed to IP (IP; 4 cycles of 5 min ischemia followed by 5 min of reperfusion) and the area at risk was analyzed for luciferase activity indicating Hif1a protein (mean±SD; n=4). (f) Transcriptional regulation of glycolytic enzymes in oxygen-stable HIF1A overexpressing HMEC-1 cells with or without siRNA mediated PER2 knockdown. Cells were treated with vehicle or Adora2b agonist BAY 60-6583 and analyzed for transcript levels of phosphofructokinase-m (PFKM), pyruvate kinase (PK), pyruvate dehydrogenase kinase 1 (PDK1) and lactate dehydrogenase a (LDHA) (mean±SD; n=3). (g) Hearts from wild-type mice were subjected to IP (IP; 4 cycles of 5 min ischemia followed by 5 min of reperfusion) and protein lysates were isolated for native protein complexes using a Per2 antibody covalently coupled (immobilized) onto an amine-reactive resin. Co-immunoprecipitated protein was analyzed using immunoblot against Hif1a. One representative blot of three is displayed. (h,i) Hearts or isolated myocytes from wildtype or Adora2b−/− were exposed to IP (IP; 4 cycles of 5 min ischemia followed by 5 min of reperfusion) or ambient hypoxia [1%, 4h], respectively, and analyzed for Hif1a protein using immunoblot. One representative blot of three is displayed. (j) Transcript levels of phosphofructokinase-m (Pfkm), pyruvate kinase (Pk), pyruvate dehydrogenase kinase 1 (Pdk1) and lactate dehydrogenase a (Ldha) from wildtype or Adora2b−/− mice after IP (IP; 4 cycles of 5 min ischemia followed by 5 min of reperfusion) treatment (mean±SD; n=3).
Figure 6
Figure 6. Light-induced stabilization of cardiac Per2 provides potent protection from myocardial ischemia
(a) Experimental model for studying light-induced stabilization of cardiac Per2 levels. (b) Following exposure to 12h of darkness, mice were exposed to indicated times of intense daylight (13,000 lux) and compared to controls that were maintained at room light. Cardiac Per2 levels were analyzed by Western blotting (n=4 mice per group). (c) Alterations of transcript levels due to daylight exposure. Cardiac transcript levels of glycolytic key enzymes in Per2−/− mice or matched littermate controls after 4 hrs of light exposure (n=4 animals per condition; Pfkm: 6-phosphofructokinase-m; Pgk1: phosphoglycerate kinase 1; Pk: pyruvate kinase; Pdk1: pyruvate dehydrogenase kinase, isozyme 1). (g,e) Per2−/− mice or littermate controls matched in age, gender and weight underwent light therapy as described above over indicated time periods, followed by exposure to in situ myocardial ischemia (60 min) followed by 2h of reperfusion. Myocardial injury was assessed by measurement of Troponin I plasma levels (n=6 mice per experimental group) or infarct staining (see also Supplementary Fig S19b, n=6 animals per group, mean±SD). (f) Wild-type mice were subjected to in situ myocardial ischemia (60 min) followed by 2h of reperfusion over a 24 h time period. Troponin or infarct sizes (scale bar represents 50 µm) were correlated to Per2 protein levels using Per2 reporter mice (*p<0.05, n=8, mean±SD, Fig. 5a, Supplementary Fig. S19c). (g) Schematic model of Adora2b-dependent Per2 stabilization and its role in regulating anaerobic glycolysis and cardiac metabolism during myocardial ischemia.

Comment in

References

    1. Eltzschig HK, Carmeliet P. Hypoxia and inflammation. N Engl J Med. 2011;364:656–665. - PMC - PubMed
    1. Sitkovsky MV, et al. Physiological control of immune response and inflammatory tissue damage by hypoxia-inducible factors and adenosine A2A receptors. Annual Review of Immunology. 2004;22:657–682. - PubMed
    1. Eltzschig HK, Eckle T. Ischemia and Reperfusion - From Mechanism to Translation. Nat Med. 2011 in press. - PMC - PubMed
    1. Neubauer S. The failing heart--an engine out of fuel. N Engl J Med. 2007;356:1140–1151. - PubMed
    1. Aragones J, Fraisl P, Baes M, Carmeliet P. Oxygen Sensors at the Crossroad of Metabolism. Cell Metab. 2009;9:11–22. - PubMed

Publication types

Substances