. 2012 Jun;78(12):4447-57.
doi: 10.1128/AEM.07998-11. Epub 2012 Apr 13.

Overexpression of genes encoding glycolytic enzymes in Corynebacterium glutamicum enhances glucose metabolism and alanine production under oxygen deprivation conditions

Affiliations

Overexpression of genes encoding glycolytic enzymes in Corynebacterium glutamicum enhances glucose metabolism and alanine production under oxygen deprivation conditions

Shogo Yamamoto et al. Appl Environ Microbiol. 2012 Jun.

Abstract

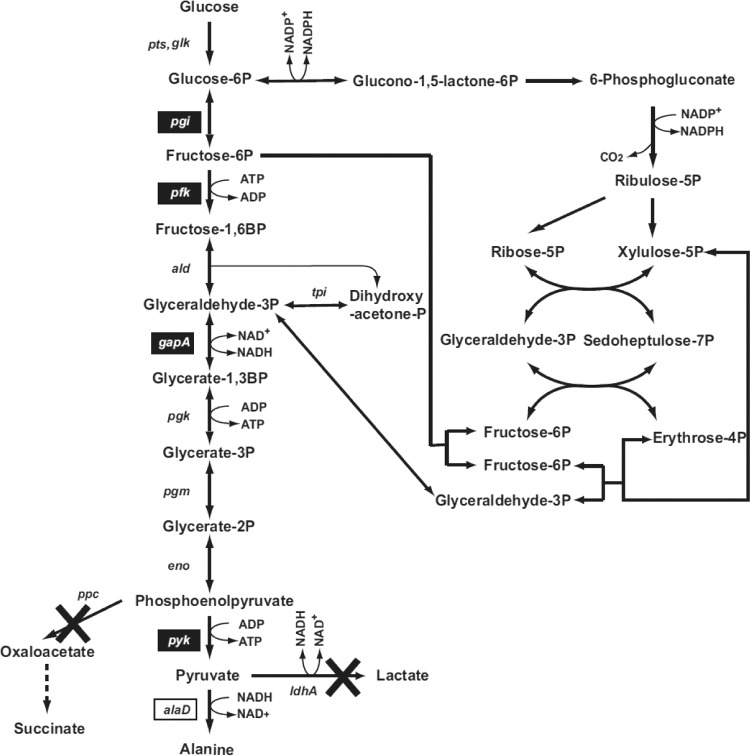
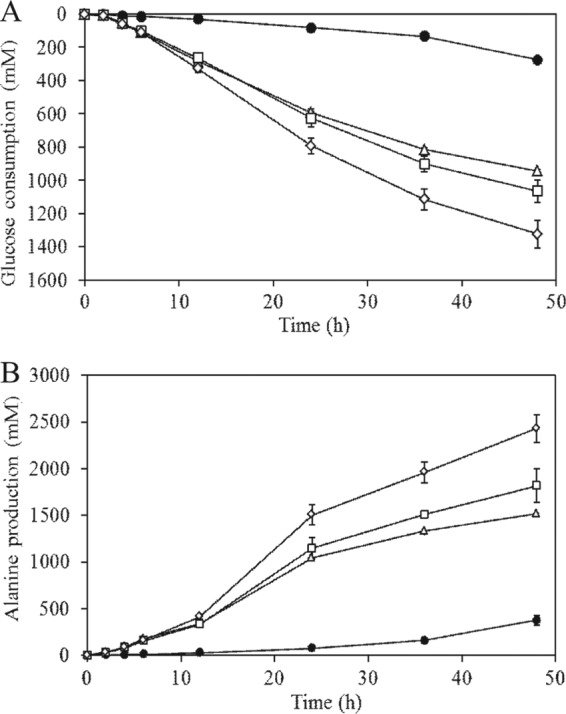
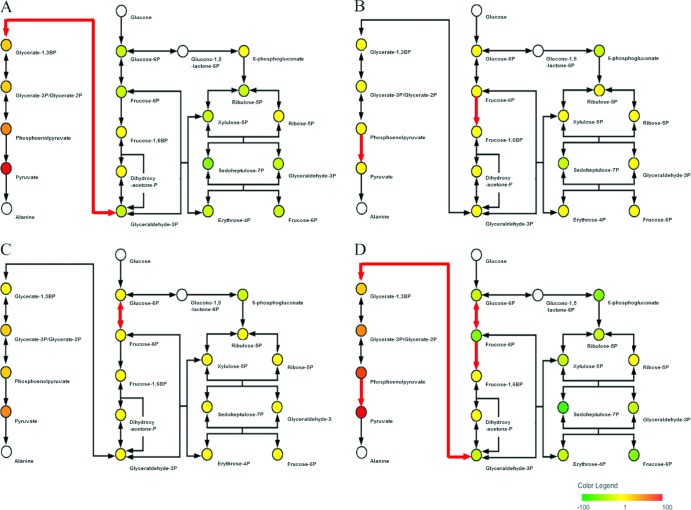
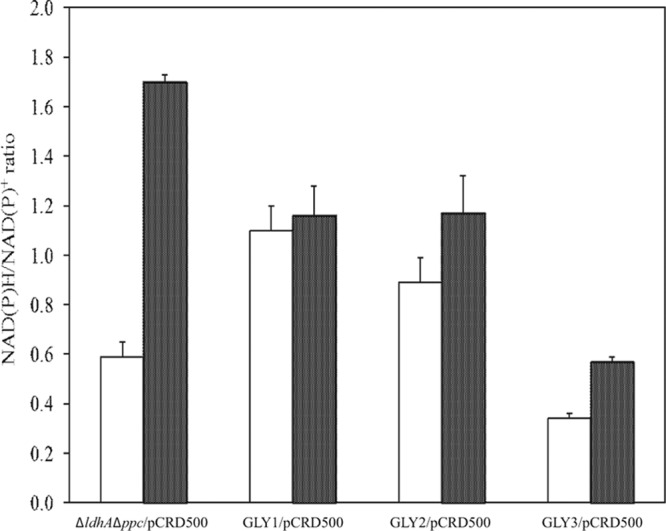
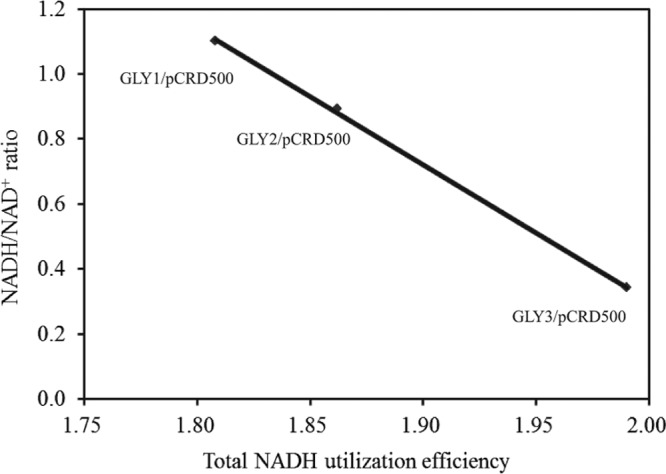
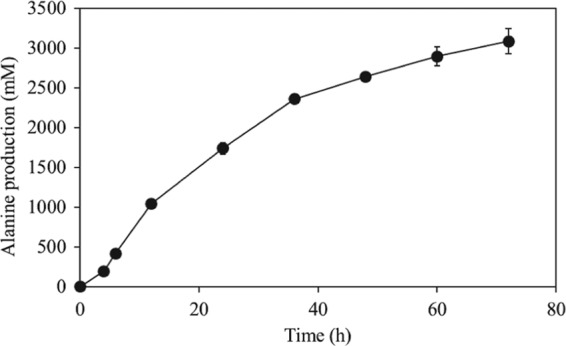
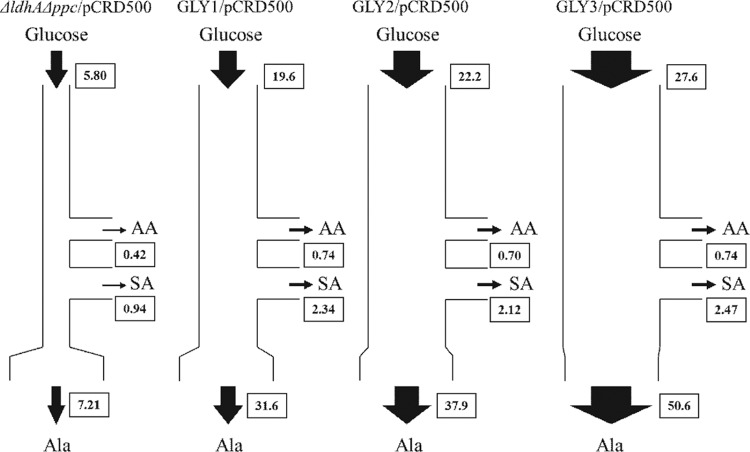
We previously reported that Corynebacterium glutamicum strain ΔldhAΔppc+alaD+gapA, overexpressing glyceraldehyde-3-phosphate dehydrogenase-encoding gapA, shows significantly improved glucose consumption and alanine formation under oxygen deprivation conditions (T. Jojima, M. Fujii, E. Mori, M. Inui, and H. Yukawa, Appl. Microbiol. Biotechnol. 87:159-165, 2010). In this study, we employ stepwise overexpression and chromosomal integration of a total of four genes encoding glycolytic enzymes (herein referred to as glycolytic genes) to demonstrate further successive improvements in C. glutamicum glucose metabolism under oxygen deprivation. In addition to gapA, overexpressing pyruvate kinase-encoding pyk and phosphofructokinase-encoding pfk enabled strain GLY2/pCRD500 to realize respective 13% and 20% improved rates of glucose consumption and alanine formation compared to GLY1/pCRD500. Subsequent overexpression of glucose-6-phosphate isomerase-encoding gpi in strain GLY3/pCRD500 further improved its glucose metabolism. Notably, both alanine productivity and yield increased after each overexpression step. After 48 h of incubation, GLY3/pCRD500 produced 2,430 mM alanine at a yield of 91.8%. This was 6.4-fold higher productivity than that of the wild-type strain. Intracellular metabolite analysis showed that gapA overexpression led to a decreased concentration of metabolites upstream of glyceraldehyde-3-phosphate dehydrogenase, suggesting that the overexpression resolved a bottleneck in glycolysis. Changing ratios of the extracellular metabolites by overexpression of glycolytic genes resulted in reduction of the intracellular NADH/NAD(+) ratio, which also plays an important role on the improvement of glucose consumption. Enhanced alanine dehydrogenase activity using a high-copy-number plasmid further accelerated the overall alanine productivity. Increase in glycolytic enzyme activities is a promising approach to make drastic progress in growth-arrested bioprocesses.


Figures

Fig 1
Fig 1
Biosynthetic pathway for alanine. Endogenous gapA, pyk, pfk, and pgi genes (in black boxes) were chromosomally integrated. Alanine dehydrogenase gene, alaD, from L. sphaericus was overexpressed via expression plasmid (white box). The genes ldhA and ppc were deleted (crossed bars) from chromosomal DNA of C. glutamicum. Relevant reactions are represented by the names of the genes coding for the enzymes as follows: pts, phosphoenolpyruvate:carbohydrate phosphotransferase system; glk, glucokinase; pgi, glucose-6-phosphate isomerase; pfk, phosphofructokinase; ald, fructose-1,6-biphosphate aldolase; gapA, glyceraldehyde-3-phosphate dehydrogenase; tpi, triosephosphate isomerase; pgk, phosphoglycerate kinase; pgm, phosphoglycerate mutase; eno, enolase; pyk, pyruvate kinase; alaD, alanine dehydrogenase; ldhA, lactate dehydrogenase; ppc, phosphoenolpyruvate carboxylase. Abbreviations: Glucose-6P, glucose-6-phosphate; Fructose-6P, fructose-6-phosphate; Fructose-1,6BP, fructose-1,6-bisphosphate; Glyceraldehyde-3P, glyceraldehyde-3-phosphate; Dihydroxyacetone-P, dihydroxyacetone phosphate; Glycerate-1,3BP, glycerate-1,3-bisphosphate; Glycerate-3P, glycerate-3-phosphate; Glycerate-2P, glycerate-2-phosphate; Glucono-1,5-lactone-6P, glucono-1,5-lactone-6-phosphate; Ribulose-5P, ribulose-5-phosphate; Ribose-5P, ribose-5-phosphate; Xylulose-5P, xylulose-5-phosphate; Sedoheptulose-7P, sedoheptulose-7-phosphate; Erythrose-4P, erythrose-4-phosphate.
Fig 2
Fig 2
Profiles of alanine production by metabolically engineered C. glutamicum under oxygen deprivation. Glucose consumption (A) and alanine production (B) by C. glutamicum recombinants ΔldhA Δppc/pCRD500 (circles), GLY1/pCRD500 (triangles), GLY2/pCRD500 (squares), and GLY3/pCRD500 (diamonds) are shown. Data points represent the averages calculated from triplicate measurements. Error bars show standard deviation.
Fig 3
Fig 3
Comparative assessment of intracellular metabolite levels between the two recombinants. The ratios of GLY1/pCRD500 to ΔldhA Δppc/pCRD500 (A), GLY2/pCRD500 to GLY1/pCRD500 (B), GLY3/pCRD500 to GLY2/pCRD500 (C), and GLY3/pCRD500 to ΔldhA Δppc/pCRD500 (D) are shown. The target genes for comparison of glycolytic intermediate levels are indicated by red arrows. Intracellular metabolites shown in white could not be determined by this method. Abbreviations of intracellular metabolites are the same as those in Fig. 1. Data points represent the averages calculated from triplicate measurements.
Fig 4
Fig 4
Redox balances in C. glutamicum recombinants under oxygen deprivation. Ratio of intracellular NADH/NAD+ (open column) and NADPH/NADP+ (solid column) were shown. Data points represent the averages calculated from triplicate measurements. Error bars show standard deviation.
Fig 5
Fig 5
NADH/NAD+ ratio measured by intracellular metabolites analysis and calculated NADH utilization efficiencies in three glycolytic gene-overexpressing recombinants, GLY1/pCRD500, GLY2/pCRD500, and GLY3/pCRD500. Total NADH utilization efficiency was calculated by adding NADH utilization efficiencies of alanine and acetic and succinic acids (see Materials and Methods).
Fig 6
Fig 6
Alanine concentration by GLY3/pCRD914 strain under oxygen deprivation. Data points represent the averages calculated from triplicate measurements. Error bars show standard deviation.
Fig 7
Fig 7
Models of the flux balance for alanine formation from glucose. Values show glucose consumption rate and formation rates of each product (mM/h). Abbreviations: AA, acetic acid; SA, succinic acid; Ala, alanine.

Similar articles

Cited by

References

    1. Babul J, Clifton D, Kretschmer M, Fraenkel DG. 1993. Glucose metabolism in Escherichia coli and the effect of increased amount of aldolase. Biochemistry 32:4685–4692 - PubMed
    1. Blombach B, et al. 2011. Corynebacterium glutamicum tailored for efficient isobutanol production. Appl. Environ. Microbiol. 77:3300–3310 - PMC - PubMed
    1. Davies SE, Brindle KM. 1992. Effects of overexpression of phosphofructokinase on glycolysis in the yeast Saccharomyces cerevisiae. Biochemistry 31:4729–4735 - PubMed
    1. Dominguez H, et al. 1998. Carbon-flux distribution in the central metabolic pathways of Corynebacterium glutamicum during growth on fructose. European journal of biochemistry / FEBS. 254:96–102 - PubMed
    1. Ehira S, Shirai T, Teramoto H, Inui M, Yukawa H. 2008. Group 2 sigma factor SigB of Corynebacterium glutamicum positively regulates glucose metabolism under conditions of oxygen deprivation. Appl. Environ. Microbiol. 74:5146–5152 - PMC - PubMed

Publication types

LinkOut - more resources