. 2012 May 16;31(10):2378-90.
doi: 10.1038/emboj.2012.87. Epub 2012 Apr 13.

The location of splenic NKT cells favours their rapid activation by blood-borne antigen

Affiliations

The location of splenic NKT cells favours their rapid activation by blood-borne antigen

Patricia Barral et al. EMBO J. .

Abstract

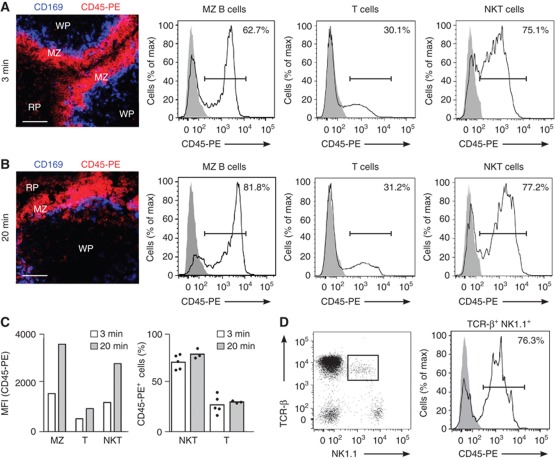
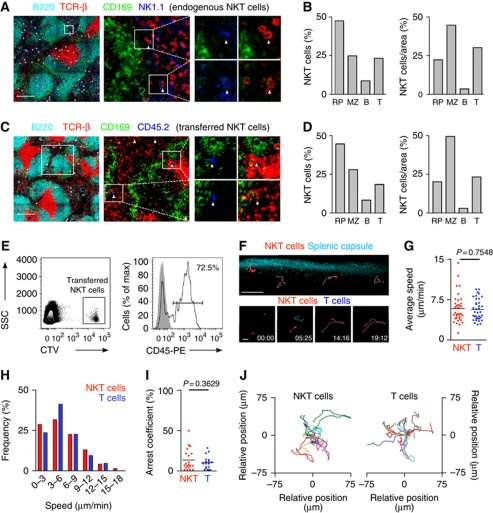
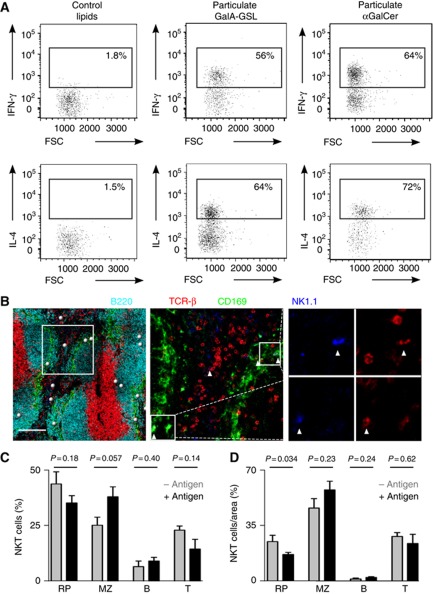
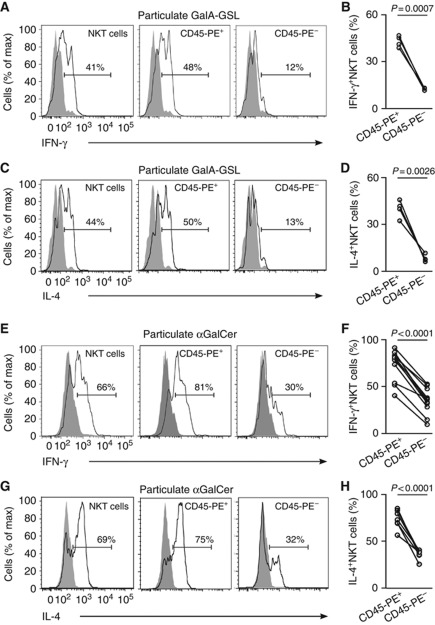
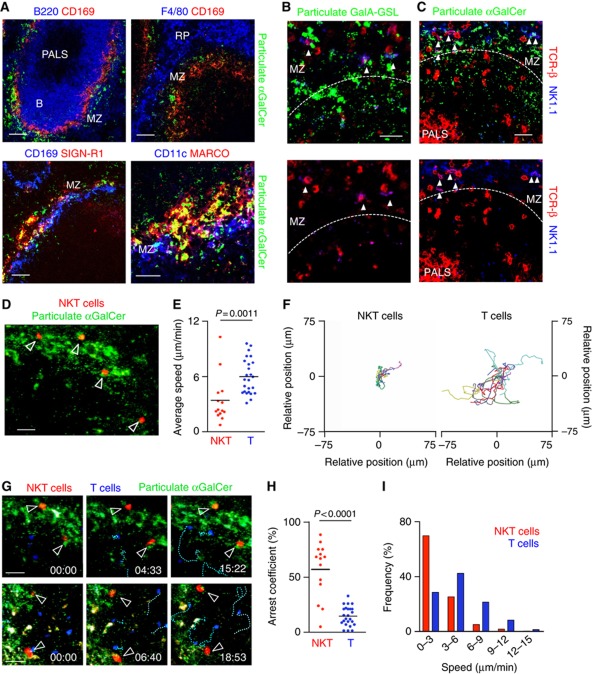
Natural killer T (NKT) cells play an important role in mounting protective responses to blood-borne infections. However, though the spleen is the largest blood filter in the body, the distribution and dynamics of NKT cells within this organ are not well characterized. Here we show that the majority of NKT cells patrol around the marginal zone (MZ) and red pulp (RP) of the spleen. In response to lipid antigen, these NKT cells become arrested and rapidly produce cytokines, while the small proportion of NKT cells located in the white pulp (WP) exhibit limited activation. Importantly, disruption of the splenic MZ by chemical or genetic approaches results in a severe reduction in NKT cell activation indicating the need of cooperation between both MZ macrophages and dendritic cells for efficient NKT cell responses. Thus, the location of splenic NKT cells in the MZ and RP facilitates their access to blood-borne antigen and enables the rapid initiation of protective immune responses.


Conflict of interest statement

The authors declare that they have no conflict of interest.

Figures

Figure 1
Figure 1
Splenic NKT cells are accessible to the blood entering the spleen. (AD) Mice were injected with CD45-PE antibody 3 min (A, C, D) or 20 min (B, C) before analyses. (A, B) Immunofluorescence (left) from spleens of mice injected with CD45-PE (red) stained with CD169 (blue). Bars, 50 μm. Flow cytometry for CD45-PE binding by splenic MZ B cells, T cells and NKT cells (black line; grey solid profile, un-injected control) (C) MFI (left) and percentage of cells (right) binding to CD45-PE in the referred splenic populations at 3 and 20 min after injection. Each dot represents an individual animal. (D) Flow cytometry of B220 splenocytes showing TCR-β and NK1.1 (left), and binding of CD45-PE by TCR−β+NK1.1+B220 cells (right). Data represent 5 independent experiments with 2 mice per experiment.
Figure 2
Figure 2
Splenic NKT cells are predominantly located in the MZ and RP. (AD) Immunofluorescence from spleen sections stained with B220 (cyan), CD169 (green), TCR-β (red) and NK1.1 (blue, A) or CD45.2 (blue, C). White dots depict NKT cells. Bars, 200 μm. (B, D) Percentages (left) and proportion of cells per area (right) of NKT cells in the RP, MZ, B cell follicles (B) and PALS (T) for endogenous (B) and adoptively transferred (D) NKT cells. (E) 2 × 10⁶ sorted NKT cells were labelled with CellTrace Violet (CTV) and injected into WT mice. 16 h later recipients were injected with CD45-PE 3 min before analysis. Transferred cells were detected in the recipient spleen as CTV+ cells (left) and showed high CD45-PE labelling (right). (F, top) Multi-photon microscopy image of the spleen showing collagen capsule (blue) and NKT cells (red). Tracks for individual cells are depicted in pink. Bar, 50 μm. (F, bottom) Snapshot images showing NKT cells (red) and T cells (blue) at the indicated time points. Individual cell tracks are coloured in pink (NKT cells) and blue (T cells). Stamp, min:sec. Bars, 20 μm. (GJ) Average speed (G), speed distribution (H), arrest coefficient (I) and migratory tracks (J) for NKT cells and T cells. Each dot represents an individual cell. Data were pooled from 2 independent experiments with 2 mice each. p, unpaired two-tailed t-test.
Figure 3
Figure 3
NKT cell activation in response to lipid antigen (A) Intracellular IFN-γ (top) and IL-4 (bottom) staining for splenic NKT cells (TCR-β+αGalCer-CD1d tetramer+B220) 2 h after injection of particulate control lipids (left), GalA-GSL (middle) or αGalCer (right). (BD) Confocal microscopy identification of endogenous NKT cells 2 h after antigen injection. (B) Spleen sections were stained with B220 (cyan), CD169 (green), TCR-β (red) and NK1.1 (blue). Bars, 200 μm. (C, D) Percentages (C) and proportion of cells per area (D) for NKT cells in the RP, MZ, B cell follicles (B) and PALS (T). Data represent 2 independent experiments. p, unpaired two-tailed t-test.
Figure 4
Figure 4
NKT cell activation occurs preferentially outside the WP. (AH) Mice were injected with particulate GalA-GSL (AD) or αGalCer (EH) and 2 h later they received CD45-PE 3 min before analyses. Flow cytometry profiles and quantification of intracellular IFN-γ (A, B and E, F) and IL-4 (C, D and G, H) for total (left) and highly (middle, CD45-PE+) or poorly (right, CD45-PE) CD45-PE labelled NKT cells (TCR-β+αGalCer-CD1d tetramer+B220). p, paired t-test. Data represent 3 independent experiments with at least 3 mice each.
Figure 5
Figure 5
NKT cells arrest in the MZ in response to lipid antigen. (AC) Mice received lipid antigen 2 h before analyses. (A) Immunofluorescence of spleen sections showing particulate αGalCer (green) stained with CD169, SIGN-R1 or MARCO (red) and B220, CD11c or F4/80 (blue). (B, C) Immunofluorescence of spleen sections showing particulate GalA-GSL (B, green) and αGalCer (C, green) and endogenous NKT cells stained with TCR-β (red) and NK1.1 (blue). Bars, 50 μm. (DI) NKT cell dynamics after antigen administration. Mice were injected with particulate αGalCer (green) 2 h before imaging. (D) Multi-photon microscopy image of the spleen showing particulate lipids (green) and NKT cells (red). Average speed (E), migratory tracks (F), snapshot images (G), arrest coefficient (H) and speed distribution (I) for splenic NKT cells (red) and T cells (blue). Individual cell tracks are coloured in pink (NKT cells) and blue (T cells). Bars, 20 μm. p, unpaired two-tailed t-test. Data were pooled from 2 independent experiments with 2 mice each.
Figure 6
Figure 6
Role of different APCs in NKT cell activation (A) Flow cytometry analyses of splenic single cell suspensions showing CD11chigh DC and SIGN-R1+ macrophage populations. (B) Flow cytometry analyses of lipid uptake by CD11chigh DCs (left) and SIGN-R1+ macrophages (right) in the spleen 2 h after injection of αGalCer particles (un-injected control, grey filled histogram). (C, D) CD1d expression in splenic DCs (C) and SIGN-R1+ macrophages (D). (E) DCs (left) and SIGN-R1+ macrophages (right) were purified by sorting and stained with CD11c and SIGN-R1 antibodies. (F) Lipid presentation by sorted DCs (Ο) and SIGN-R1+ MZ macrophages (formula image
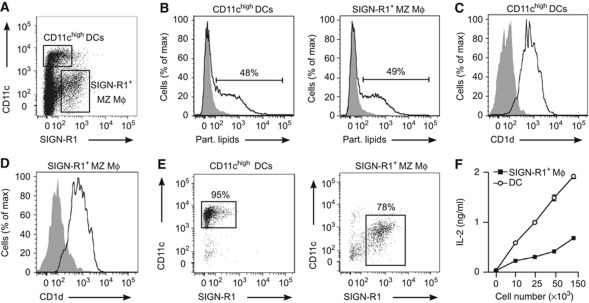
) incubated with αGalCer particles previous to co-culture with DN32.D3 NKT cells. Secretion of IL-2 into the culture medium by DN32.D3 cells was measured as a read-out for lipid presentation.
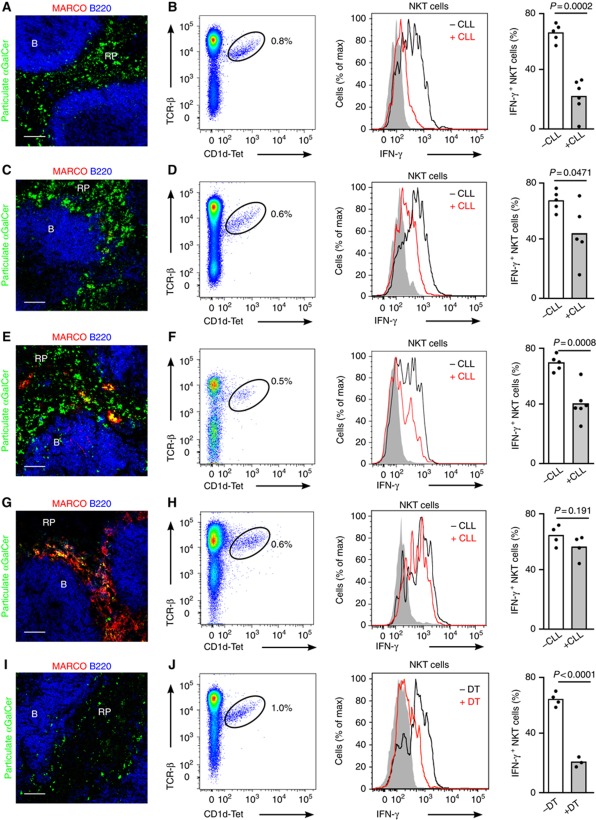
Figure 7
Figure 7
Disruption of the MZ reduces NKT cell activation. (AJ) Mice were injected with particulate αGalCer 2 h before analyses. Confocal microscopy images (A, C, E, G, I) and flow cytometry profiles (B, D, F, H, J) of spleens from WT mice treated with CLL for 2 days (A, B), 6 days (C, D), 16 days (E, F) or 22 days (G, H) and CD11c-DOG mice treated with DT (I, J). Immunofluorescence images show particulate αGalCer (green), MARCO (red) and B220 (blue); Bars, 50 μm. Flow-cytometry plots show NKT cells (left), intracellular IFN-γ staining for NKT cells (middle) and quantification of IFN-γ production (right) for NKT cells in treated (+) and untreated (−) mice. p, unpaired two-tailed t-test. Data represent 2 independent experiments with at least 3 mice per experiment.

References

    1. Aichele P, Zinke J, Grode L, Schwendener RA, Kaufmann SHE, Seiler P (2003) Macrophages of the splenic marginal zone are essential for trapping of blood-borne particulate antigen but dispensable for induction of specific T cell responses. J Immunol 171: 1148–1155 - PubMed
    1. Andrews DM, Farrell HE, Densley EH, Scalzo AA, Shellam GR, Degli-Esposti MA (2001) NK1.1+ cells and murine cytomegalovirus infection: what happens in situ? J Immunol 166: 1796–1802 - PubMed
    1. Aoshi T, Zinselmeyer BH, Konjufca V, Lynch JN, Zhang X, Koide Y, Miller MJ (2008) Bacterial entry to the splenic white pulp initiates antigen presentation to CD8+ T cells. Immunity 29: 476–486 - PubMed
    1. Backer R, Schwandt T, Greuter M, Oosting M, Jungerkes F, Tuting T, Boon L, O’toole T, Kraal G, Limmer A, Den Haan JMM (2010) Effective collaboration between marginal metallophilic macrophages and CD8+ dendritic cells in the generation of cytotoxic T cells. Proceedings of the National Academy of Sciences 107: 216–221 - PMC - PubMed
    1. Bajénoff M, Glaichenhaus N, Germain RN (2008) Fibroblastic reticular cells guide T lymphocyte entry into and migration within the splenic T cell zone. J Immunol 181: 3947–3954 - PMC - PubMed

Publication types