. 2012 May;122(5):1849-68.
doi: 10.1172/JCI59218. Epub 2012 Apr 16.

Epithelial-mesenchymal transition can suppress major attributes of human epithelial tumor-initiating cells

Affiliations

Epithelial-mesenchymal transition can suppress major attributes of human epithelial tumor-initiating cells

Toni Celià-Terrassa et al. J Clin Invest. 2012 May.

Abstract

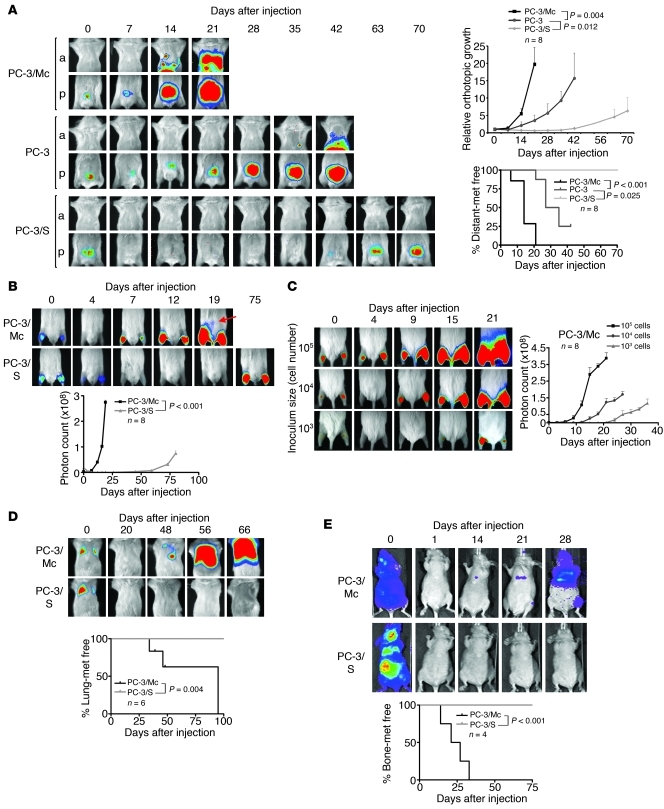
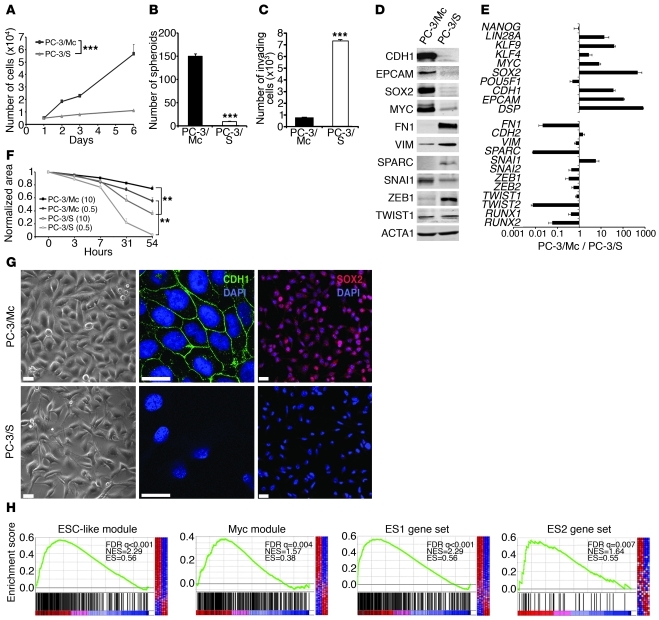
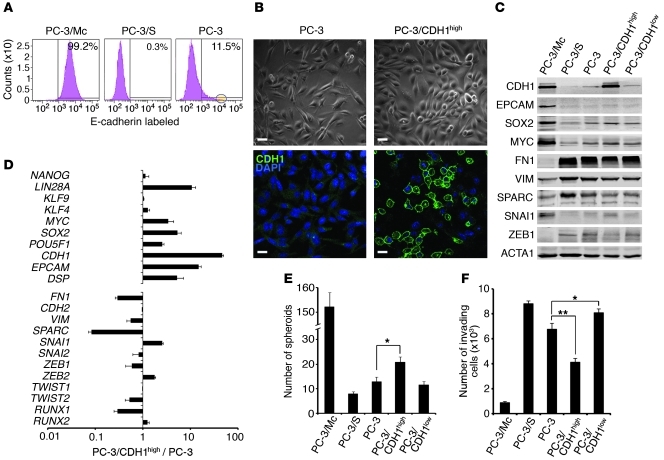
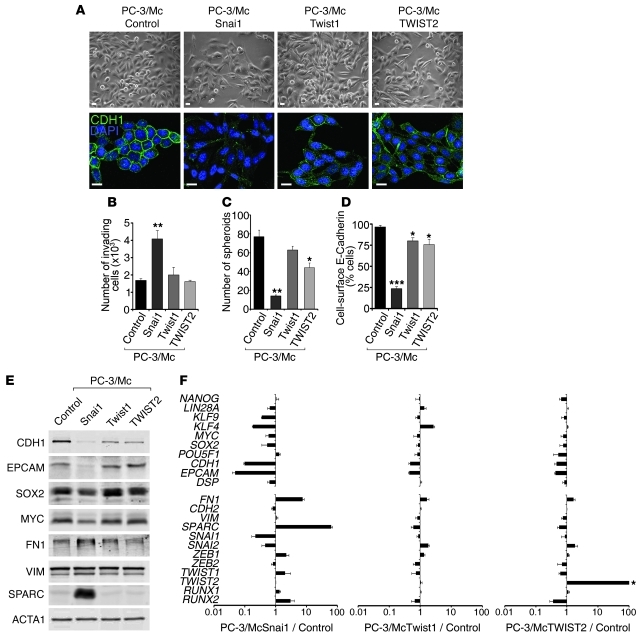
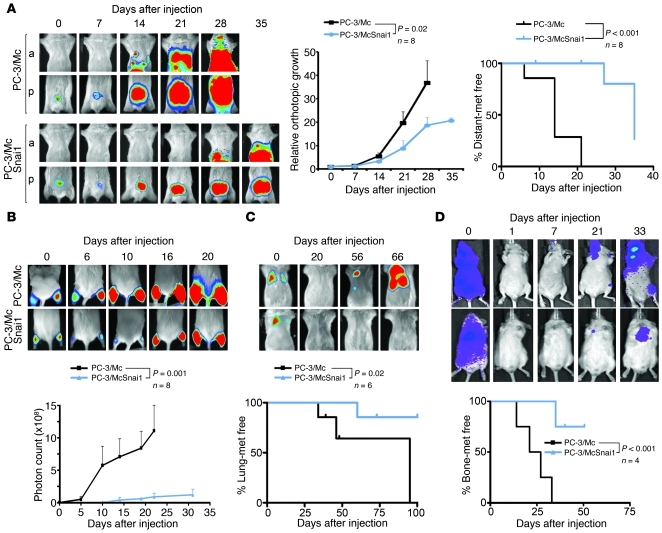
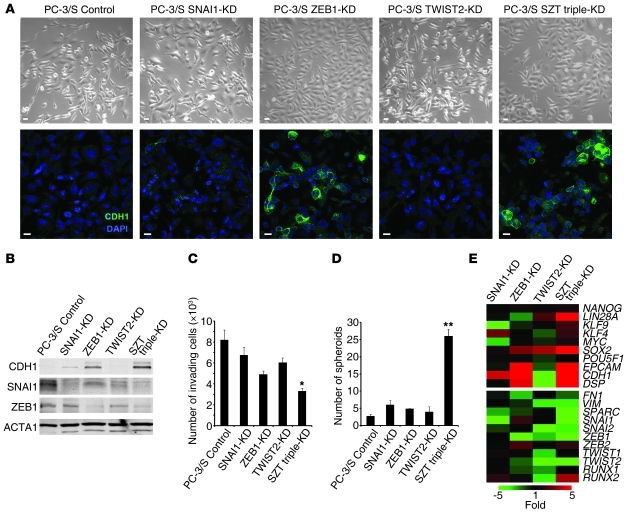
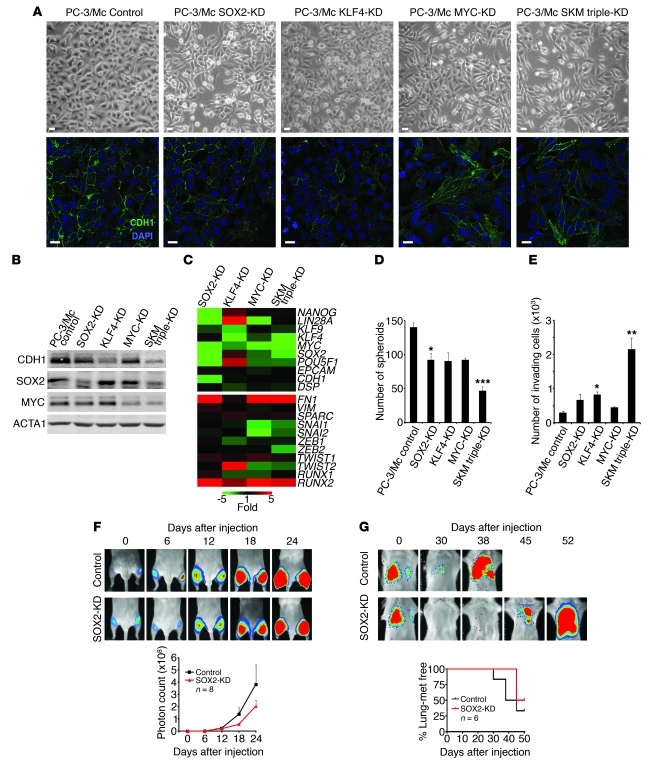
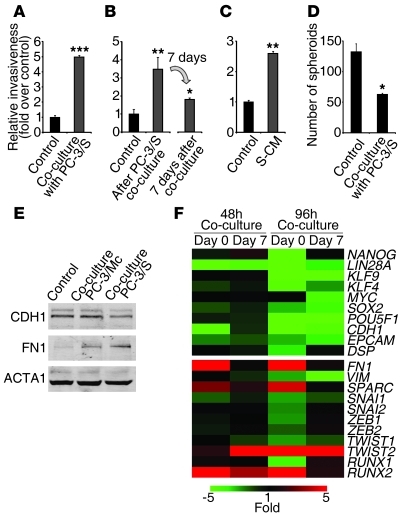
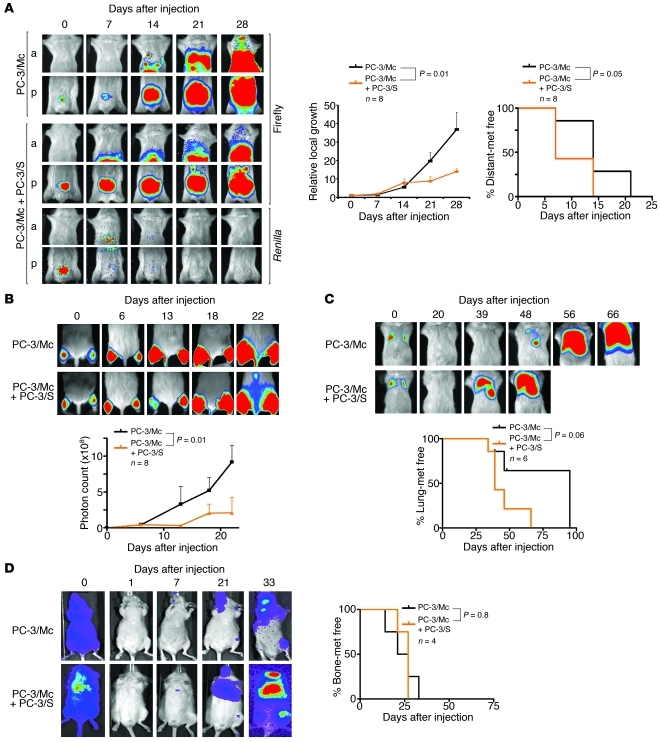
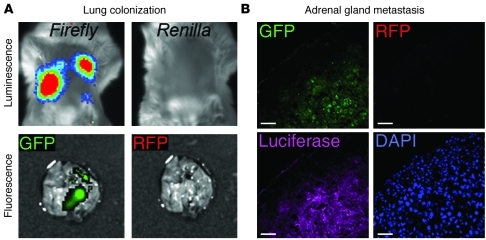
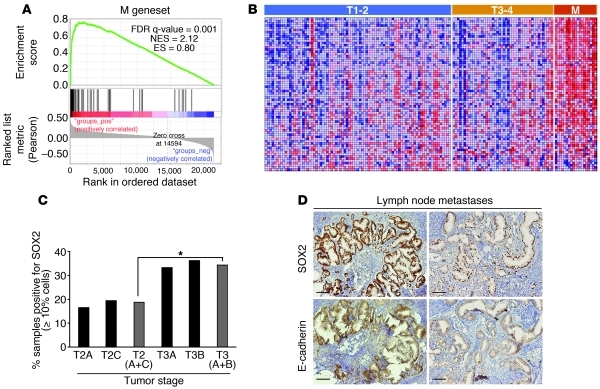
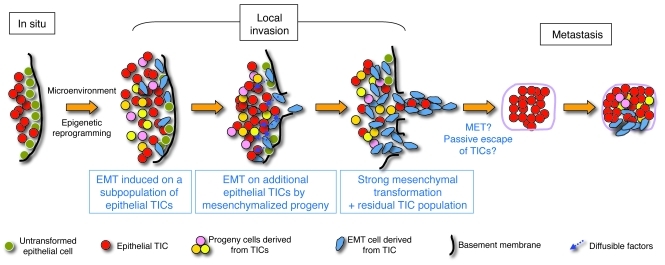
Malignant progression in cancer requires populations of tumor-initiating cells (TICs) endowed with unlimited self renewal, survival under stress, and establishment of distant metastases. Additionally, the acquisition of invasive properties driven by epithelial-mesenchymal transition (EMT) is critical for the evolution of neoplastic cells into fully metastatic populations. Here, we characterize 2 human cellular models derived from prostate and bladder cancer cell lines to better understand the relationship between TIC and EMT programs in local invasiveness and distant metastasis. The model tumor subpopulations that expressed a strong epithelial gene program were enriched in highly metastatic TICs, while a second subpopulation with stable mesenchymal traits was impoverished in TICs. Constitutive overexpression of the transcription factor Snai1 in the epithelial/TIC-enriched populations engaged a mesenchymal gene program and suppressed their self renewal and metastatic phenotypes. Conversely, knockdown of EMT factors in the mesenchymal-like prostate cancer cell subpopulation caused a gain in epithelial features and properties of TICs. Both tumor cell subpopulations cooperated so that the nonmetastatic mesenchymal-like prostate cancer subpopulation enhanced the in vitro invasiveness of the metastatic epithelial subpopulation and, in vivo, promoted the escape of the latter from primary implantation sites and accelerated their metastatic colonization. Our models provide new insights into how dynamic interactions among epithelial, self-renewal, and mesenchymal gene programs determine the plasticity of epithelial TICs.


Figures

Figure 1
Figure 1. Divergent growth and metastatic potentials of 2 clonal populations derived from PC-3 prostate cancer cells.
(A) PC-3/Mc, but not PC-3/S, cells rapidly formed tumors upon orthotopic implantation in NOD-SCID mice, developing lymph node and distant metastases as early as 14 days after implantation. Parental PC-3 cells grew and metastasized with efficiencies intermediate between the 2 clonal populations. Cells (1.0 × 10⁵) were implanted in the ventral lobes of 6-week-old male mice. Anterior (a) or posterior (p) halves were imaged independently for enhanced resolution. Upper right panel: growth curves of orthotopic tumors, with photon counts normalized to values on day 0. Lower right panel: Kaplan-Meier plots for metastasis-free (met free) mice. (B) PC-3/Mc cells grew rapidly after i.m. grafting (2.0 × 10⁵ cells), with detection in lymph nodes after 19 days (arrow). PC-3/S cells formed tumors after 75 days, without detectable distant spread. Bottom panel: growth curves at the i.m. implantation sites. (C) Grafting of limited numbers of PC-3/Mc cells readily produced tumors. 105, 104, or 103 cells were injected i.m. in each hind limb. Right panel: growth curves at the i.m. implantation site. (D) PC-3/Mc, but not PC-3/S, cells readily colonized lungs upon i.v. injection (2.5 × 10⁵ cells). Bottom panel: Kaplan-Meier plots for lung colonization–free mice at each time point. (E) PC-3/Mc, but not PC-3/S, cells readily colonized bones upon i.c. injection (2.0 × 10⁵ cells). Bottom panel: Kaplan-Meier plots for bone metastasis–free mice. Results are expressed as mean ± SEM.
Figure 2
Figure 2. Opposing phenotypes and distinct gene programs expressed by 2 clonal populations derived from PC-3 cells.
(A) PC-3/Mc cells grew with short doubling times (22–24 hours), while PC-3/S cells grew with long doubling times (60–72 hours). (B) PC-3/Mc, but not PC-3/S, cells displayed robust anchorage-independent growth. Cells (103) seeded in low-attachment plates in the presence of 0.5% methyl cellulose were scored for spheroids after 14 days (triplicate assays). (C) PC-3/Mc cells were barely invasive, while PC-3/S cells were highly invasive. Cells seeded on the upper chamber of Matrigel- and hyaluronic acid–coated Transwell units were scored for invading cells after 24 hours (triplicate assays). (D) PC-3/Mc cells expressed higher levels than PC-3/S cells of E-cadherin and EpCAM. PC-3/S cells expressed higher levels than PC-3/Mc cells of fibronectin, vimentin, and SPARC, by Western blotting. (E) PC-3/Mc cells expressed higher levels than PC-3/S cells of genes associated with self renewal and pluripotency. PC-3/S cells expressed higher levels than PC-3/Mc cells of genes associated with mesenchymal phenotypes and EMT. Relative transcript levels are represented as the log10 of ratios between the 2 cell lines of their 2–ΔΔCp real-time PCR values. (F) PC-3/S cells were more motile than PC-3/Mc cells in wound-healing assays (triplicate assays). Parentheses denote percentages of FBS. (G) PC-3/Mc cells were round and expressed membrane-associated E-cadherin and nuclear SOX2. PC-3/S cells were flat and spindled and with undetectable E-cadherin. Scale bar: 20 μm. (H) Gene-set enrichment analysis (GSEA) showing significant enrichment in PC-3/Mc cells of the ESC-like, MYC, ES1, and ES2 gene modules. FDR q, false discovery rate q value; NES, normalized enrichment score; ES, enrichment score. Results are expressed as mean ± SEM. **P < 0.01; ***P < 0.001.
Figure 3
Figure 3. E-cadherin–positive PC-3 cells show an enhanced anchorage-independent growth and a stronger expression of a self-renewal gene program relative to parental or E-cadherin–negative cells.
(A) Over 99% of PC-3/Mc cells were positive, and 0.3% of PC-3/S cells were positive for surface E-cadherin. A minor fraction (11.5%) of parental PC-3 prostate cancer cells expressed cell-surface E-cadherin. The circle on the right panel indicates the 1% sorted population with the highest CDH1 expression (PC-3/CDH1hi). (B) The bulk of parental PC-3 cells displayed a spindled morphology and low levels of membrane-bound E-cadherin. Most PC-3/CDH1hi cells displayed a round morphology and a strong expression of membrane-bound E-cadherin. Scale bars: 20 μm. (C) PC-3/CDH1hi cells expressed higher levels of MYC and SOX2 and lower levels of the mesenchymal markers fibronectin or ZEB1 than PC-3/S or PC-3/CDH1lo cells, as determined by Western blotting. (D) PC-3/CDH1hi cells expressed self-renewal/ pluripotency genes at levels significantly higher than parental PC-3 cells, as determined by real-time qPCR. Relative transcript levels are represented as the log10 of ratios between the 2 subpopulations of their 2–ΔΔCp real-time PCR values. (E) PC-3/CDH1hi cells grew more spheroids than E-cadherin–negative (PC-3/CDH1lo) or parental PC-3 cells. For comparison, the spheroid growth of PC-3/Mc and PC-3/S cells is also illustrated. (F) PC-3/CDH1hi cells were less invasive in Transwell-Matrigel assays than PC-3/CDH1lo or parental PC-3 cells. For comparison, the invasiveness of PC-3/Mc and PC-3/S cells is also illustrated. Results are expressed as mean ± SEM. *P < 0.05; **P < 0.01.
Figure 4
Figure 4. Overexpression of Snai1 in PC-3/Mc cells induces EMT and suppresses anchorage-independent growth and the expression of a self-renewal gene program.
(A) Overexpression of Snai1, Twist1, or TWIST2 in PC-3/Mc cells induced a fibroblastoid morphology and a downregulation of membrane-associated E-cadherin. Cells were transduced with retroviruses for the expression of mouse Snai1 or Twist1 or human TWIST2. Controls were PC-3/Mc cells transduced with pBABE and selected for puromycin resistance. Scale bars: 20 μm. (B) Overexpression of Snai1 strongly induced the invasiveness of PC-3/Mc cells, with a moderate effect by Twist1 or TWIST2. (C) Overexpression of Snai1 strongly inhibited spheroid growth by PC-3/Mc cells, with a moderate effect by TWIST2. (D) Overexpression of Snai1 in PC-3/Mc cells caused a strong downregulation of cell-surface E-cadherin, with a moderate effect by Twist1 or TWIST2, as determined by flow cytometry. (E) Overexpression of Snai1 in PC-3/Mc cells induced a downregulation of E-cadherin and EpCAM, a modest downregulation of SOX2 and MYC, and an upregulation of fibronectin and SPARC, as determined by Western blotting. Overexpression of Twist1 or TWIST2 induced a moderate downregulation of E-cadherin. (F) Overexpression of Snai1 and, more moderately, Twist1 or TWIST2, caused a downregulation of self-renewal and epithelial genes and an upregulation of mesenchymal genes. Relative transcript levels are represented as the log10 of ratios between experimental and control cells of their 2–ΔΔCp real-time PCR values. The levels of SNAI1 correspond to the endogenous, human transcripts, downregulated by overexpression of the exogenous (mouse) Snai1. Asterisk in F indicates that values for ectopic TWIST2 are off scale. Results are expressed as mean ± SEM. *P < 0.05; **P < 0.01; ***P < 0.001.
Figure 5
Figure 5. Constitutive overexpression of Snai1 inhibits local growth, metastatic spread, and distant organ colonization of PC-3/Mc cells.
(A) Overexpression of Snai1 strongly inhibited local growth and metastatic spread after orthotopic prostatic implantation of PC-3/Mc-SNAI1 cells (1.0 × 10⁵) in 6-week-old male NOD-SCID mice. Anterior or posterior halves were imaged independently for enhanced resolution. Middle panel: growth curves of orthotopic tumors, with photon counts normalized to values on day 0. Right panel: Kaplan-Meier plots for metastasis-free mice. (B) Overexpression of Snai1 strongly inhibited the growth of PC-3/Mc cells (2.5 × 10⁵) grafted i.m. Mice grafted with control PC-3/Mc cells were euthanized at day 22 after grafting. Bottom panel: growth curve at the i.m. implantation site. (C) Overexpression of Snai1 prevented lung colonization of PC-3/Mc cells (2.5 × 10⁵) inoculated i.v. Bottom panel: Kaplan-Meier plots for lung colonization–free mice. (D) Overexpression of Snai1 suppressed bone colonization of PC-3/Mc cells (2.0 × 10⁵) inoculated i.c. Bottom panel: Kaplan-Meier plots for bone colonization–free mice. Results are expressed as mean ± SEM.
Figure 6
Figure 6. Knockdown of EMT transcription factors in mesenchymal-like PC-3/S cells causes a gain in anchorage-independent growth and the expression of a self-renewal gene network.
(A). Knockdown of SNAI1, ZEB1, TWIST2, or a triple SZT knockdown in PC-3/S cells was associated with fewer cells with fibroblastoid morphologies and a gain in the expression of E-cadherin, most evident in ZEB1 knockdowns (single or triple SZT). Scale bars: 20 μm. (B) Knockdown in mesenchymal-like PC-3/S cells of SNAI1, ZEB1, or a triple SZT knockdown caused an upregulation of E-cadherin, as determined by Western blotting, with the strongest effect observed in the triple knockdown. (C) Knockdown of SNAI1, ZEB1, TWIST2, or a triple SZT knockdown caused a diminished invasive capacity of PC-3/S cells in Transwell-Matrigel assays, with the triple SZT knockdown showing the strongest effects. (D) Knockdown of SNAI1, ZEB1, TWIST2, or a triple SZT knockdown caused a gain in the capacity of PC-3/S cells to grow spheroids, with the triple knockdown showing the strongest effects. (E) Knockdown of SNAI1, ZEB1, TWIST2, or a triple SZT knockdown in mesenchymal-like PC-3/S cells caused an upregulation of the epithelial genes CDH1, EPCAM, and DSP and of the self-renewal/ pluripotency genes LIN28, SOX2, MYC, and KLF4, most evident for the triple SZT knockdown. Real-time RT-PCR values, determined by the ΔΔCp method, are represented as a heat map with pseudocoloring ranging from green (underexpressed relative to values in control PC-3/S cell) to red (overexpressed relative to control PC- 3/S cells). Controls were puromycin-selected PC-3/S cells bearing control pLK0-scrambled lentiviral vector. Results are expressed as mean ± SEM. *P < 0.05; **P < 0.01.
Figure 7
Figure 7. E-cadherin is required for anchorage-independent growth and lung colonization of PC-3/Mc cells.
(A) Knockdown of E-cadherin in PC-3/Mc cells downregulated SOX2 and MYC. Controls were puromycin-selected PC-3/Mc cells bearing pLK0-scrambled lentiviral vector. (B) Knockdown of E-cadherin enhanced the invasiveness of PC-3/Mc cells. (C) Knockdown of E-cadherin inhibited the spheroid-forming potential of PC-3/Mc cells. (D) Knockdown of E-cadherin in PC-3/Mc cells caused a modest downregulation of self-renewal/pluripotency genes. Relative transcript levels are represented as the log10 of ratios between experimental and control cells of 2–ΔΔCp real-time PCR values. Controls were PC-3/Mc cells bearing pLK0-scrambled vector. (E) Knockdown of E-cadherin in PC-3/Mc cells detected by indirect immunofluorescence. Scale bars: 20 μm. (F) Knockdown of E-cadherin in PC-3/Mc cells inhibited their lung colonization after i.v. injection into SCID mice. The Kaplan-Meier plot reflects the actuarial numbers of lung colonization–free mice. (G) Overexpression of E-cadherin in PC-3/S cells caused a downregulation of FN1. (H) Overexpression of E-cadherin strongly inhibited the invasiveness of PC-3/S cells. (I) Overexpression of E-cadherin strongly enhanced the spheroid-forming potential of PC-3/S cells. (J) Overexpression of E-cadherin strongly enhanced the tumorigenicity of PC-3/S cells. PC-3/S-CDH1 and control cells (5 × 10⁵) were implanted i.m. in the hind limbs of male Swiss-nude mice and tumor growth monitored with a caliper. (K) Overexpression of E-cadherin induced a moderate upregulation of self-renewal/pluripotency genes and a moderate downregulation of mesenchymal genes. Asterisk in K shows E-cadherin levels determined in murine E-cadherin–overexpressing cells reflect the exogenous transcripts, quantified with mouse-specific primers and probes (values are off scale). Results are expressed as mean ± SEM. *P < 0.05; **P < 0.01; ***P < 0.001.
Figure 8
Figure 8. Self-renewal factors are required for a strong epithelial program, anchorage-independent growth, and lung colonization of PC-3/Mc cells.
(A) Knockdown in PC-3/Mc cells of SOX2, KLF4, MYC, or a triple SKM knockdown induced a fibroblastoid morphology and downregulation of membrane-associated E-cadherin. Controls were puromycin-selected PC-3/Mc cells bearing pLK0-scrambled control vector. Scale bars: 20 μm. (B) Knockdown in PC-3/Mc cells of SOX2, KLF4, MYC, or a triple SKM knockdown caused a downregulation of E-cadherin, strongest for the triple knockdown and KLF4. (C) Knockdown in PC-3/Mc cells of SOX2, KLF4, MYC, or a triple SKM knockdown caused a downregulation of CDH1 and an upregulation of FN1 and SPARC. Real-time RT-PCR values, determined by the ΔΔCp method, are represented as a heat map (green, underexpressed relative to control PC-3/Mc cells; red, overexpressed). (D) Knockdown of SOX2, KLF4, MYC, or a triple SKM knockdown caused an inhibition of the capacity of PC-3/Mc cells to grow spheroids under anchorage-independent conditions, strongest for the triple knockdown. (E) Knockdown of SOX2, KLF4, MYC, or a triple SKM knockdown caused an enhanced invasiveness of PC-3/Mc cells, strongest for the triple knockdown. (F) Knockdown of SOX2 was sufficient to inhibit the tumorigenic potential of PC-3/Mc cells. Cells (2.0 × 10⁵) were implanted i.m. in male SCID mice. Bottom panel: graphical representation of photon counts at the indicated times. (G) Knockdown of SOX2 was sufficient to inhibit lung colonization by PC-3/Mc cells. Cells (2.5 × 10⁵) were inoculated i.v. in male SCID mice. Bottom: Kaplan-Meier actuarial plot for lung colonization–free mice. Results are expressed as mean ± SEM. *P < 0.05; **P < 0.01; ***P < 0.001.
Figure 9
Figure 9. Downregulation of E-cadherin from PC-3/Mc cells at primary implantation sites and maintenance of its expression in lung metastasis.
(A) Downregulation of E-cadherin and upregulation of fibronectin in PC-3/Mc cells after implantation in NOD-SCID mice. Seven days after i.m. implantation, PC-3/Mc cells, homogeneously positive for E-cadherin and negative for fibronectin in culture prior to implantation, become heterogeneous for expression of membrane-associated E-cadherin, as determined by immunohistochemistry (left panel), and downregulate E-cadherin and upregulate fibronectin, as determined by Western blotting (right panel). Lanes separated by the white lines were run on the same gel but were noncontiguous. Scale bar: 100 μm. (B) PC-3/Mc cells that had metastasized to lungs after i.v. injection were largely positive for nuclear SOX2 and membrane-associated E-cadherin, as determined by immunohistochemistry. Scale bars: 100 μm.
Figure 10
Figure 10. PC-3/S cells enhance the invasiveness of PC-3/Mc cells.
(A) Coculture with PC-3/S cells induced the invasiveness of PC-3/Mc cells. Green-labeled PC-3/Mc cells were cocultured with red-labeled PC-3/S cells on Transwell units and green or red fluorescent invading cells scored by flow cytometry. Controls were green-labeled PC-3/Mc cells cocultured with unlabeled PC-3/Mc cells. (B) The enhanced invasiveness of PC-3/Mc cells was maintained for several days after coculture with PC-3/S cells. GFP-labeled PC-3/Mc cells were cocultured for 48 hours with red-labeled PC-3/S cells, sorted, and assayed for invasiveness either immediately or 7 days later. (C) Diffusible factors secreted by PC-3/S cells enhanced the invasiveness of PC-3/Mc cells. PC-3/Mc cells were exposed for 48 hours to CM from PC-3/S cells (S-CM) and assayed for invasiveness. (D) Coculture with PC-3/S cells inhibited the spheroid growth of PC-3/Mc cells. GFP-expressing PC-3/Mc cells and RFP-expressing PC-3/S cells were cocultured and scored for spheroids after 14 days. (E) Coculture of PC-3/Mc cells with PC-3/S cells induced a downregulation of E-cadherin and an upregulation of fibronectin. Green-labeled PC-3/Mc cells and red-labeled PC-3/S cells were cocultured for 48 hours, sorted, and analyzed by Western blotting. (F) PC-3/Mc cells cocultured with PC-3/S cells shifted their transcriptional programs following a time-dependent reversion after coculture. Green-labeled PC-3/Mc cells were cocultured with red-labeled PC-3/S cells for 48 or 96 hours, sorted, and analyzed either immediately (day 0) or 7 days after sorting (day 7). Relative qPCR transcript levels are represented as a heat map (green, underexpressed relative to control PC-3/Mc; red, overexpressed). Results are expressed as mean ± SEM. *P < 0.05; **P < 0.01; ***P < 0.001.
Figure 11
Figure 11. PC-3/S cells facilitate the spread and metastatic growth of PC-3/Mc cells.
(A) Orthotopic coimplantation of GFP-PC-3/Mc cells with RFP- and Renilla luciferase–expressing PC-3/S cells in the ventral prostate of NOD-SCID mice diminished their growth rate at the implantation, while accelerating the appearance of metastatic growth. Bioluminescence monitoring was performed separately for the anterior and posterior halves of the mice, for improved resolution. Middle: growth curves of orthotopically implanted tumor cells, with photon counts normalized relative to values on day 0. Right: Kaplan-Meier actuarial plots for metastasis-free mice. (B) Coimplantation (i.m.) of GFP-PC-3/Mc cells with RFP-PC-3/S cells diminished their growth rate as compared with GFP-PC-3/Mc cells implanted alone. Bottom: graphical representation of growth at the implantation site. (C) Coinoculation (i.v.) of GFP-PC-3/Mc cells with RFP-PC-3/S cells accelerated their lung colonization. Bottom: Kaplan-Meier actuarial plots for lung colony–free mice. (D) Coinoculation (i.c.) of GFP-PC-3/Mc cells with RFP-PC-3/S cells did not significantly affect their bone colonization efficiency. Right panel: Kaplan-Meier actuarial plots for bone colony–free mice. Results are expressed as mean ± SEM.
Figure 12
Figure 12. Metastases formed after joint injection of PC-3/Mc and PC-3/S cells contain exclusively epithelial PC-3/Mc cells.
(A) Only PC-3/Mc cells, but not PC-3/S cells, colonized lungs after joint i.v. injection. PC-3/S, but not PC-3/Mc, cells also expressed Renilla luciferase. Firefly luciferase, but not Renilla, signal was detected in lung tumors. In parallel, GFP (expressed by GFP-PC-3/Mc cells) or RFP (expressed by RFP-PC-3/S cells) was visualized microscopically. Only GFP signal, but not RFP signal, was detected in lung tumors. (B) Only PC-3/Mc cells, but not PC-3/S cells, colonize adrenal glands after i.c. joint inoculation. Thirty-three days after inoculation, mice were sacrificed and adrenal metastatic tumors frozen and processed for fluorescent visualization of GFP or RFP and for immunofluorescent detection of firefly luciferase (as a marker common to both cell types). Samples were counterstained for nuclei with DAPI. Only GFP signal, but not RFP signal, was detected in adrenal metastases. Scale bars: 50 μm.
Figure 13
Figure 13. Expression of a self-renewal gene network active in PC-3/Mc cells is associated with more advanced stages of prostate cancer.
(A) GSEA on an expression data set for 150 prostate cancer samples (45) showing a significant enrichment of the M geneset (genes of the ESC module [ref. 13] enriched in PC-3/Mc cells) in metastases relative to primary tumors, and in T3 and T4 stage primary tumors relative to T1 and T2 stage primary tumors. Pearson’s correlation was applied to determine linear relationships between gene profiles and 3 phenotypes (class 1: metastatic; class 2: T3 and T4 stage primary; class 3: T1 and T2 stage primary) taken as continuous variables. (B). Heat map illustrating the relative expression levels for the 70 genes of the M gene set. Samples are ordered as primary tumors with stages T1 or T2, stages T3 or T4, or metastases (M). (C) Ninety-four cases of prostate cancer were analyzed for SOX2 expression by immunohistochemistry. Positive cases contained at least 10% of cells with nuclear SOX2 staining. *P < 0.05, between the frequencies of SOX2-positive cases in stages T2A and T2C versus and stage T3A and T3B tumors. (D) In some lymph node metastases, but in none of the 94 primary tumors, all visible tumor cells were strongly positive for nuclear SOX2, and stronger SOX2 expression correlated with stronger E-cadherin expression. Right: a second metastatic sample with a more heterogeneous and weaker nuclear SOX2 staining of tumor cells displays weaker membrane E-cadherin staining. Scale bars: 100 μm.
Figure 14
Figure 14. A model of metastasis potentiated by cooperation between tumor cell populations expressing either epithelial/TIC or mesenchymal programs.
We propose a model in which some TICs, with properties of CSCs, undergo EMT under the influence of environmental factors. This results in epigenetic reprogramming, including a repression in those cells of pluripotency programs that sustain cell self renewal. These “mesenchymalized” cells, in turn, either through direct cell-cell interaction or through diffusible factors, drive the mesenchymal conversion of additional populations of TIC/CSCs that have not yet undergone EMT, resulting in a reinforcement of the mesenchymalization of the tumor. The predominantly mesenchymalized populations of tumor cells complete the breach of local barriers and thus the tumor becomes fully invasive. The tumor cells escaping from the local site would thus be a combination of stably mesenchymalized tumor cells, cells retaining TIC/CSC properties that leave the tumor following paths open by actively invading cells (passive escape), or TIC/CSCs that have undergone transient EMT (active escape). After hematogenous or lymphogenous spread, TIC/CSCs that have not undergone EMT or that have reverted to an epithelial program and phenotype from their transient EMT (MET) can establish distant metastases. This cycle may be repeated at the metastatic site. Tumor cells with stable mesenchymal-like phenotypes that have escaped from the local tumor site but that do not revert to an epithelial gene program and phenotype would not have the capacity to establish distant metastases.

Comment in

  • Metastasis: dynamic interactions.
    Seton-Rogers S. Seton-Rogers S. Nat Rev Cancer. 2012 May 24;12(6):378. doi: 10.1038/nrc3282. Nat Rev Cancer. 2012. PMID: 22622640 No abstract available.

References

    1. Feinberg AP, Ohlsson R, Henikoff S. The epigenetic progenitor origin of human cancer. Nat Rev Genet. 2006;7(1):21–33. doi: 10.1038/nrg1748. - DOI - PubMed
    1. Axelrod R, Axelrod DE, Pienta KJ. Evolution of cooperation among tumor cells. Proc Natl Acad Sci U S A. 2006;103(36):13474–13479. doi: 10.1073/pnas.0606053103. - DOI - PMC - PubMed
    1. Balkwill F. Cancer and the chemokine network. Nat Rev Cancer. 2004;4(7):540–550. doi: 10.1038/nrc1388. - DOI - PubMed
    1. Yang MH, et al. Direct regulation of TWIST by HIF-1alpha promotes metastasis. Nat Cell Biol. 2008;10(3):295–305. doi: 10.1038/ncb1691. - DOI - PubMed
    1. Merlo LM, Pepper JW, Reid BJ, Maley CC. Cancer as an evolutionary and ecological process. Nat Rev Cancer. 2006;6(12):924–935. doi: 10.1038/nrc2013. - DOI - PubMed

Publication types

MeSH terms