. 2012 May 2;104(9):670-81.
doi: 10.1093/jnci/djs177. Epub 2012 Apr 13.

A DNA repair pathway-focused score for prediction of outcomes in ovarian cancer treated with platinum-based chemotherapy

Affiliations

A DNA repair pathway-focused score for prediction of outcomes in ovarian cancer treated with platinum-based chemotherapy

Josephine Kang et al. J Natl Cancer Inst. .

Abstract

Background: New tools are needed to predict outcomes of ovarian cancer patients treated with platinum-based chemotherapy. We hypothesized that a molecular score based on expression of genes that are involved in platinum-induced DNA damage repair could provide such prognostic information.

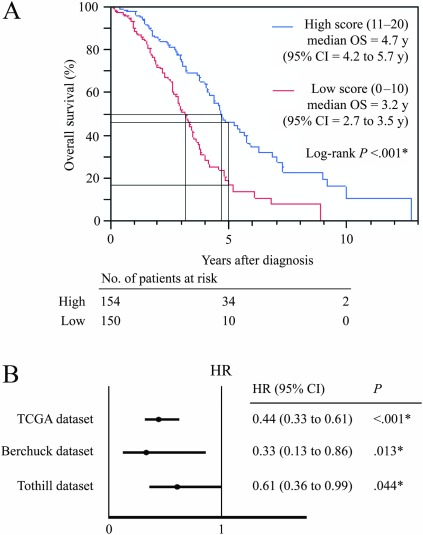
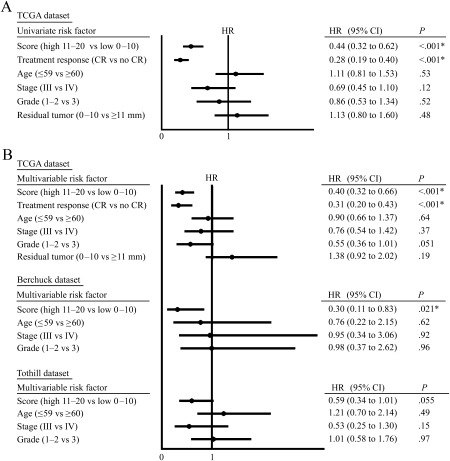
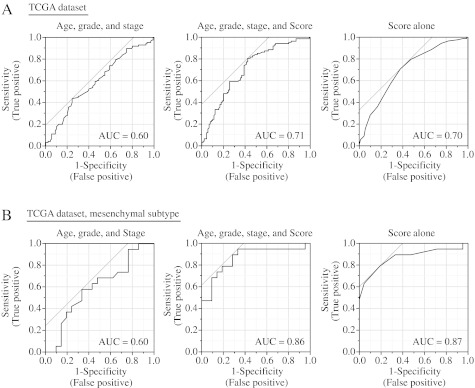
Methods: Gene expression data was extracted from The Cancer Genome Atlas (TCGA) database for 151 DNA repair genes from tumors of serous ovarian cystadenocarcinoma patients (n = 511). A molecular score was generated based on the expression of 23 genes involved in platinum-induced DNA damage repair pathways. Patients were divided into low (scores 0-10) and high (scores 11-20) score groups, and overall survival (OS) was analyzed by Kaplan-Meier method. Results were validated in two gene expression microarray datasets. Association of the score with OS was compared with known clinical factors (age, stage, grade, and extent of surgical debulking) using univariate and multivariable Cox proportional hazards models. Score performance was evaluated by receiver operating characteristic (ROC) curve analysis. Correlations between the score and likelihood of complete response, recurrence-free survival, and progression-free survival were assessed. Statistical tests were two-sided.

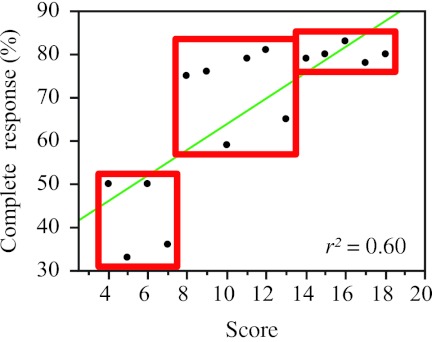
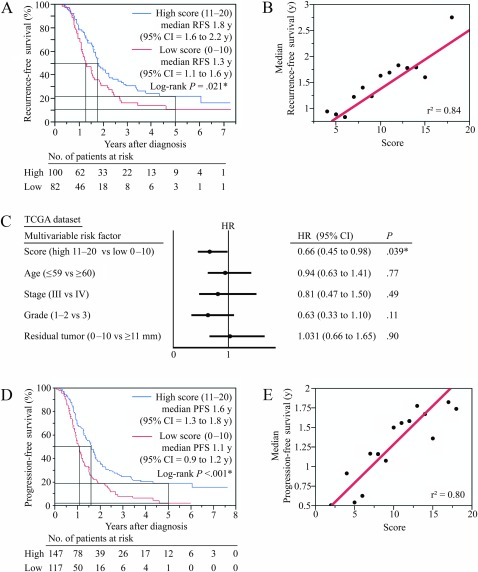
Results: Improved survival was associated with being in the high-scoring group (high vs low scores: 5-year OS, 40% vs 17%, P < .001), and results were reproduced in the validation datasets (P < .05). The score was the only pretreatment factor that showed a statistically significant association with OS (high vs low scores, hazard ratio of death = 0.40, 95% confidence interval = 0.32 to 0.66, P < .001). ROC curves indicated that the score outperformed the known clinical factors (score in a validation dataset vs clinical factors, area under the curve = 0.65 vs 0.52). The score positively correlated with complete response rate, recurrence-free survival, and progression-free survival (Pearson correlation coefficient [r(2)] = 0.60, 0.84, and 0.80, respectively; P < .001 for all).

Conclusion: The DNA repair pathway-focused score can be used to predict outcomes and response to platinum therapy in ovarian cancer patients.


Figures

Figure 1
Figure 1
DNA repair pathway–focused score in prognosis of overall survival. For each patient's tumor, a point was given for each DNA repair gene for which higher than median expression was associated with longer survival, and vice versa. The sum of these points constituted the score. Only genes in pathways related to platinum-induced damage repair were included. Advanced-stage (stages III and IV) ovarian cancer patients from The Cancer Genome Atlas (TCGA) dataset who received a platinum and taxane regimen as first-line chemotherapy (n = 304) were arbitrarily divided into low (scores 1–10) vs high (scores 11–20) scores. A) Kaplan–Meier analysis was used to assess median overall survival (OS) and 5-year OS (indicated by black lines) from time of pathological diagnosis in low- and high-scoring subgroups. P < .001, calculated using a two-sided log-rank test. B) Univariate analysis was performed using the Cox proportional hazards regression analyses to assess whether the score was prognostic for OS in the TCGA dataset. Solid circles represent hazard ratio (HR) of death and open-ended horizontal lines represent the 95% confidence intervals (CIs). This was validated in the two published datasets by Berchuck et al. (9) and Tothill et al. (11). *P < .05; all P values were calculated using Cox proportional hazards analysis.
Figure 2
Figure 2
Comparison of the score with prognostic clinical covariates. Univariate and multivariable Cox proportional hazards regression analyses incorporating the score (high [scores 11–20] vs low [scores 0–10]) and known prognostic clinical factors, including response to primary therapy (complete response [CR] vs non-CR) by Response Evaluation Criteria In Solid Tumors (RECIST) criteria (45), age at diagnosis (≤59 vs ≥60 years), International Federation of Gynecology and Obstetrics (FIGO) (46) stage (III vs IV), grade (1–2 vs 3), and extent of surgical debulking (0–10 vs ≥11 mm residual tumor); each as categorical variables. Solid circles represent the hazard ratio (HR) of death and open-ended horizontal lines represent the 95% confidence intervals (CIs). *P < .05; all P values were calculated using Cox proportional hazards analysis. A) Univariate analysis was performed using Cox proportional hazards regression analyses in The Cancer Genome Atlas (TCGA) dataset of patients with advanced-stage ((stages III and IV) ovarian cancer treated with platinum and taxane chemotherapy. B) Multivariable analysis was performed in the TCGA and two validation datasets by Berchuck et al. (9) and Tothill et al. (11), adjusting for the same categorical variables.
Figure 3
Figure 3
Receiver operating characteristic (ROC) analysis of the score and clinical covariates in predicting overall survival. The area under the curve (AUC) was calculated for ROC curves, and sensitivity and specificity was calculated to assess score performance. A) Using statistical models constructed based on multivariable Cox proportional hazards, ROC curves were calculated incorporating clinical variables of age, grade, and stage (left); age, grade, stage, and score (middle); and score alone (right). B) ROC curves, including only patients with tumors of mesenchymal TCGA subtype, were also calculated incorporating clinical variables of age, grade, and stage (left); age, grade, stage, and score (middle); and score alone (right). Grey lines indicate the 45º angle tangent line marked at a point that provides best discrimination between true positives and false positives, assuming that false positives and false negatives have similar costs.
Figure 4
Figure 4
Correlation of score with complete response (CR). Advanced-stage (stages III and IV) ovarian cancer patients from The Cancer Genome Atlas (TCGA) dataset who received platinum and taxane as first-line chemotherapy (n = 304 patients) were analyzed based on their individual scores. For each patient's tumor, a point was given for each DNA repair gene for which higher than median expression was associated with longer survival, and vice versa. The sum of these points constituted our score. The percentage of patients achieving CR based on the Response Evaluation Criteria In Solid Tumors (RECIST) criteria was calculated for each score value and is represented by the black solid circles. The Pearson correlation coefficient (r2) was used to assess the relationship between the score and likelihood of CR. Patients were classified into lowest (score ≤ 7), middle (score 8–13), and highest (score ≥ 14) tertiles (shown in boxes). The straight line depicts the least squares linear regression line through the data points.
Figure 5
Figure 5
Ability of the score to predict recurrence-free survival (RFS) and progression-free survival (PFS). For each patient's tumor, a point was given for each DNA repair gene for which higher than median expression was associated with longer survival, and vice versa. The sum of these points constituted our score. Only genes in pathways related to platinum-induced damage repair were included. Advanced-stage (stages III and IV) ovarian cancer patients from The Cancer Genome Atlas (TCGA) dataset who received a platinum and taxane regimen as first-line chemotherapy (n = 304 patients) were analyzed to assess the relationship between score and RFS and PFS. A) The association of score and RFS was assessed in the TCGA ovarian cancer patients who achieved a complete response (CR) after receiving the first-line platinum and taxane therapy. The Kaplan–Meier method was used to compare RFS in patients with low (scores 1–10) vs high (scores 11–20) scores. *P value was calculated using a two-sided log-rank test. B) TCGA ovarian cancer patients who achieved a CR after the first-line platinum and taxane therapy were analyzed, by calculating median RFS for each score subgroup, represented by the black solid circles. The Pearson correlation coefficient (r2) was calculated to assess the relationship between score and RFS. The straight line depicts the least squares linear regression line through the data points. C) Multivariable analysis of factors that impact RFS was performed in TCGA ovarian cancer patients who achieved a CR following platinum and taxane chemotherapy. Cox proportional hazards regression was performed for score (high, 11–20, vs low, 1–10), treatment response (CR vs no CR), age (≤59 vs ≥60 years), International Federation of Gynecology and Obstetrics (FIGO) stage (III vs IV), grade (1–2 vs 3), and extent of surgical debulking (0–10 vs ≥11 mm). Solid circles represent the hazard ratio (HR) of death and open-ended horizontal lines represent the 95% confidence intervals (CIs). *P values were calculated using a two-sided log-rank test. D) The association of score and PFS was assessed in the TCGA ovarian cancer patients with available data. The Kaplan–Meier method was used to compare PFS in patients with low (scores 1–10) vs high (scores 11–20) scores. *P value was calculated using a two-sided log-rank test. E) TCGA ovarian cancer patients with PFS data were analyzed, by calculating median PFS for each score subgroup, represented by the black solid circles. The Pearson correlation coefficient (r2) was calculated to assess the relationship between score and PFS. The straight line depicts the least squares linear regression line through the data points.

Comment in

References

    1. Jemal A, Siegel R, Xu J, et al. Cancer statistics, 2010. CA Cancer J Clin. 2010;60(5):277–300. - PubMed
    1. Pignata S, Cannella L, Leopardo D, et al. Chemotherapy in epithelial ovarian cancer. Cancer Lett. 2011;303(2):73–83. - PubMed
    1. Barakat RR, Markman M, Randall ME. Principles and Practice of Gynecologic Oncology. 5 ed. Philadelphia, PA: Lippincott Williams & Wilkins; 2009.
    1. Kunos CA, Sill MW, Buekers TE, et al. Low-dose abdominal radiation as a docetaxel chemosensitizer for recurrent epithelial ovarian cancer: a phase I study of the Gynecologic Oncology Group. Gynecol Oncol. 2011;120(2):224–228. - PMC - PubMed
    1. Herzog TJ. Clinical experience with topotecan in relapsed ovarian cancer. Gynecol Oncol. 2003;90(3, pt 2):S3–S7. - PubMed

Publication types

MeSH terms