

Identification and characterization of lineage-specific highly conserved noncoding sequences in Mammalian genomes
- PMID: 22505575
- PMCID: PMC3381673
- DOI: 10.1093/gbe/evs035
Identification and characterization of lineage-specific highly conserved noncoding sequences in Mammalian genomes
Abstract
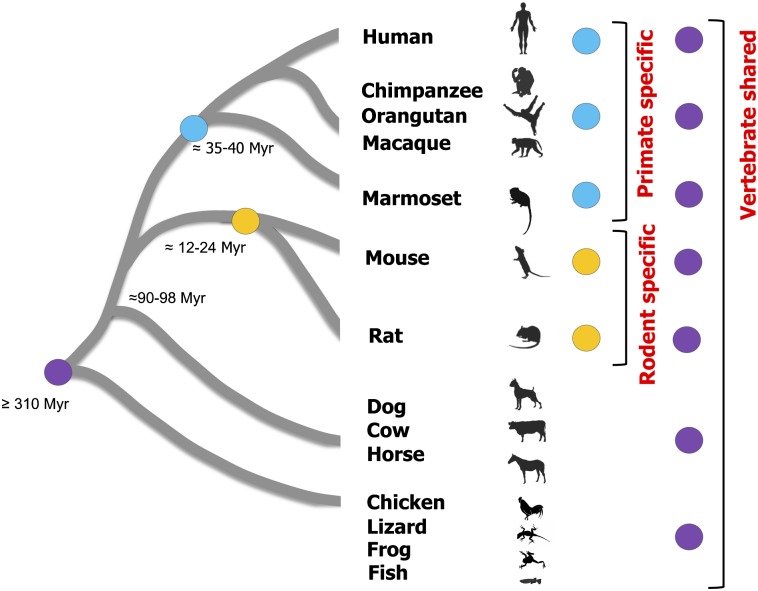
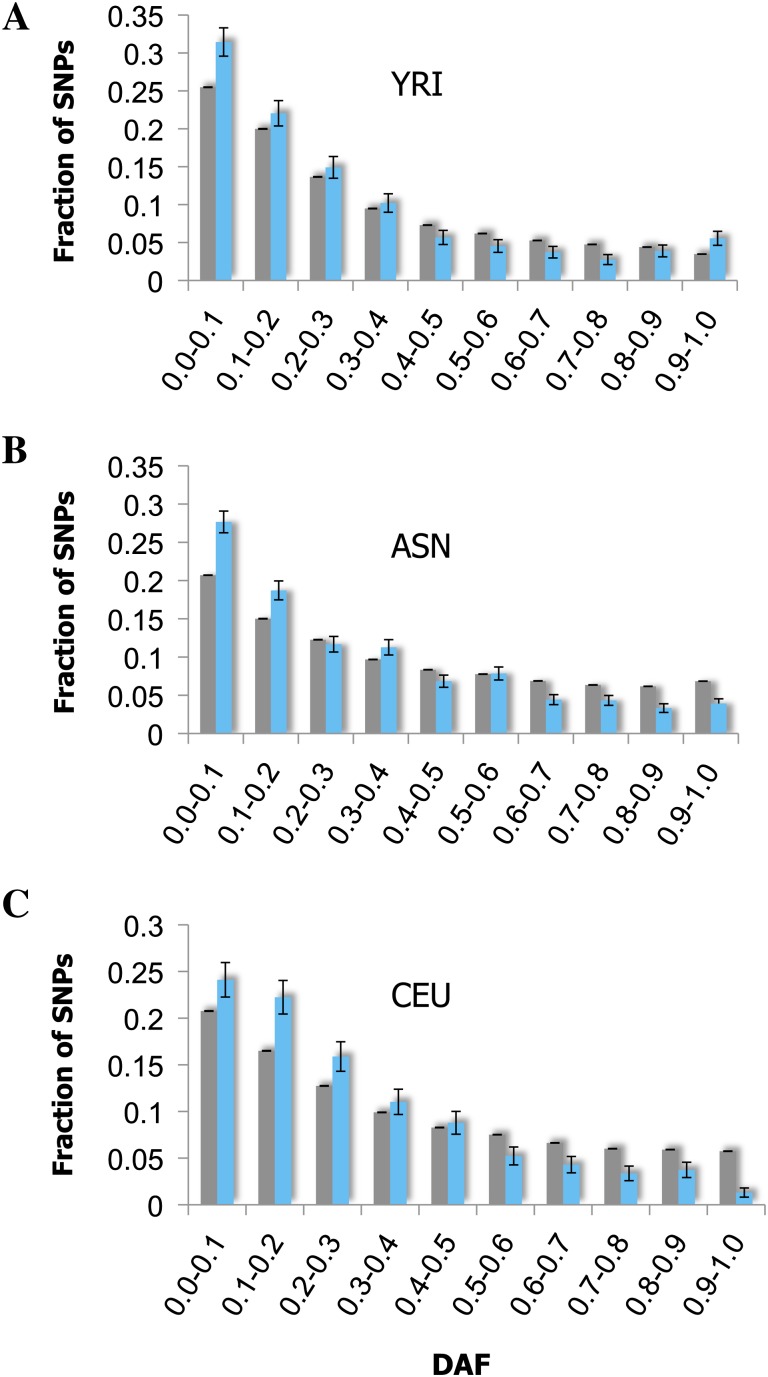
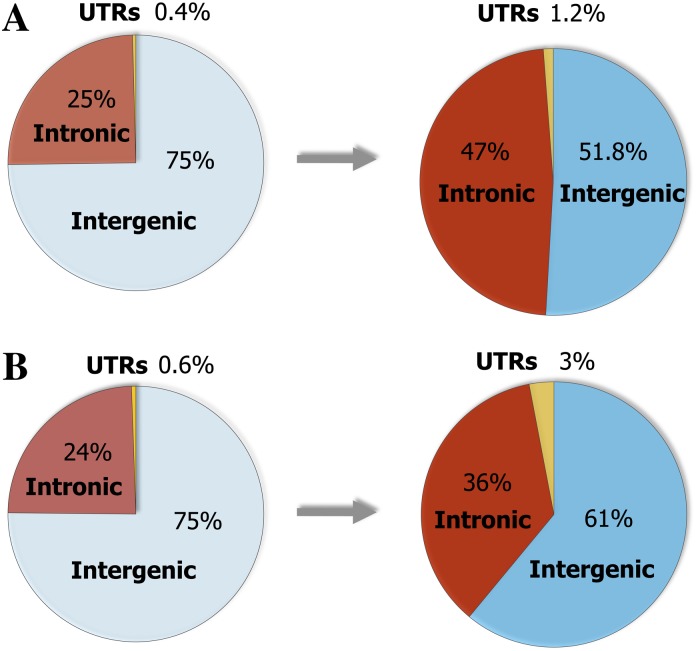
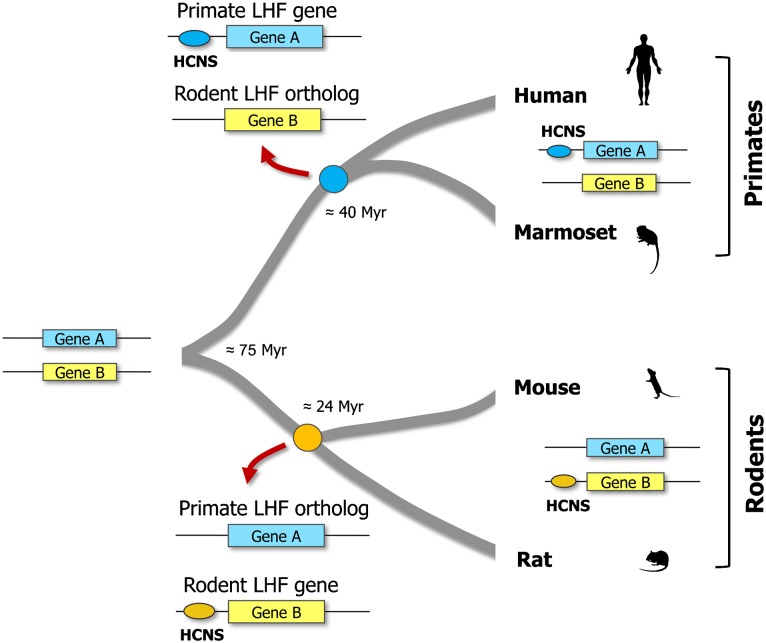
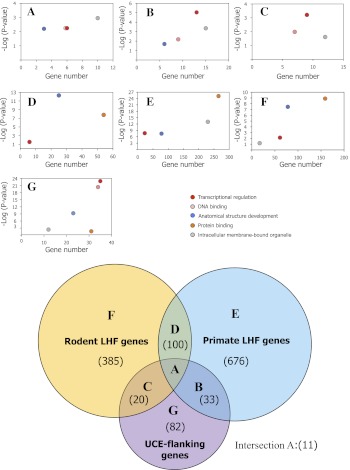
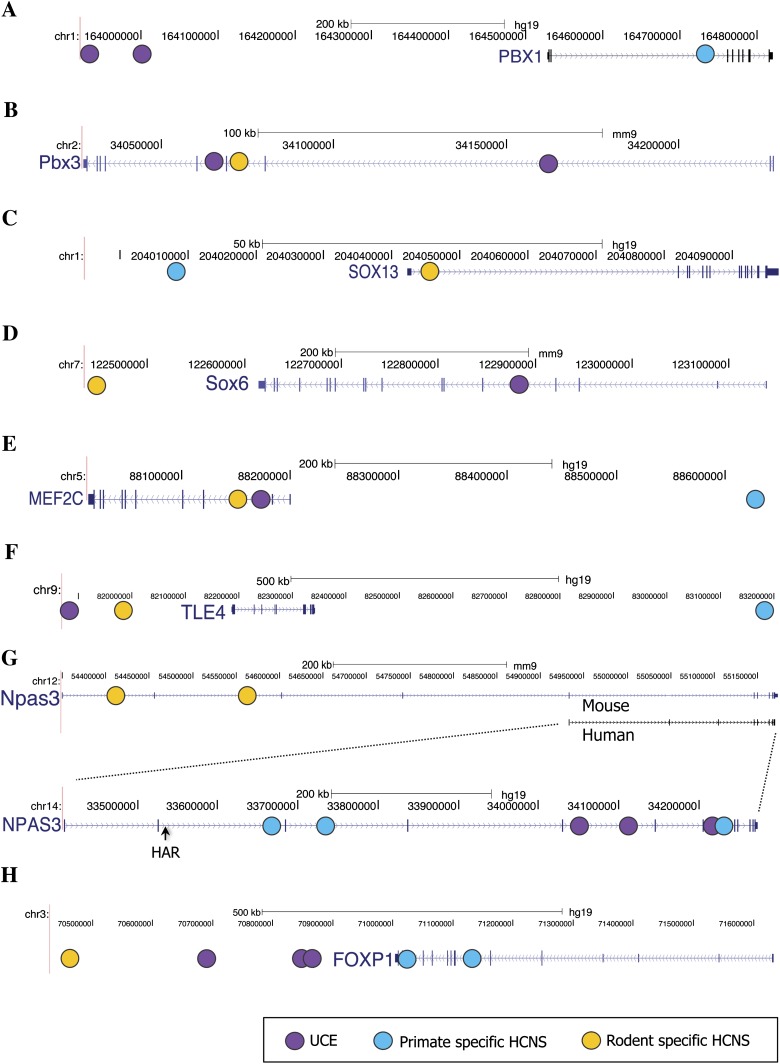
Vertebrate genome comparisons revealed that there are highly conserved noncoding sequences (HCNSs) among a wide range of species and many of which contain regulatory elements. However, recently emerged sequences conserved in specific lineages have not been well studied. Toward this end, we identified 8,198 primate and 21,128 specific HCNSs as representative ones among mammals from human-marmoset and mouse-rat comparisons, respectively. Derived allele frequency analysis of primate-specific HCNSs showed that these HCNSs were under purifying selection, indicating that they may harbor important functions. We selected the top 1,000 largest HCNSs and compared the lineage-specific HCNS-flanking genes (LHF genes) with ultraconserved element (UCE)-flanking genes. Interestingly, the majority of LHF genes were different from UCE-flanking genes. This lineage-specific set of LHF genes was more enriched in protein-binding function. Conversely, the number of LHF genes that were also shared by UCEs was small but significantly larger than random expectation, and many of these genes were involved in anatomical development as transcriptional regulators, suggesting that certain groups of genes preferentially recruit new HCNSs in addition to old HCNSs that are conserved among vertebrates. This group of LHF genes might be involved in the various levels of lineage-specific evolution among vertebrates, mammals, primates, and rodents. If so, the emergence of HCNSs in and around these two groups of LHF genes developed lineage-specific characteristics. Our results provide new insight into lineage-specific evolution through interactions between HCNSs and their LHF genes.
Figures
Similar articles
-
Emergence and Evolution of Hominidae-Specific Coding and Noncoding Genomic Sequences.Genome Biol Evol. 2016 Jul 12;8(7):2076-92. doi: 10.1093/gbe/evw132. Genome Biol Evol. 2016. PMID: 27289096 Free PMC article.
-
Silencing Effect of Hominoid Highly Conserved Noncoding Sequences on Embryonic Brain Development.Genome Biol Evol. 2017 Aug 1;9(8):2037-2048. doi: 10.1093/gbe/evx105. Genome Biol Evol. 2017. PMID: 28633494 Free PMC article.
-
Evolutionary growth process of highly conserved sequences in vertebrate genomes.Gene. 2012 Aug 1;504(1):1-5. doi: 10.1016/j.gene.2012.05.003. Epub 2012 May 9. Gene. 2012. PMID: 22580082
-
Organization of conserved elements near key developmental regulators in vertebrate genomes.Adv Genet. 2008;61:307-38. doi: 10.1016/S0065-2660(07)00012-0. Adv Genet. 2008. PMID: 18282512 Review.
-
Ultraconserved elements: genomics, function and disease.RNA Biol. 2008 Jul-Sep;5(3):132-4. doi: 10.4161/rna.5.3.6673. Epub 2008 Jul 25. RNA Biol. 2008. PMID: 18708752 Review.
Cited by
-
Heterogeneous tempo and mode of conserved noncoding sequence evolution among four mammalian orders.Genome Biol Evol. 2013;5(12):2330-43. doi: 10.1093/gbe/evt177. Genome Biol Evol. 2013. PMID: 24259317 Free PMC article.
-
Lineage-specific conserved noncoding sequences of plant genomes: their possible role in nucleosome positioning.Genome Biol Evol. 2014 Sep;6(9):2527-42. doi: 10.1093/gbe/evu188. Genome Biol Evol. 2014. PMID: 25364802 Free PMC article.
-
Emergence and Evolution of Hominidae-Specific Coding and Noncoding Genomic Sequences.Genome Biol Evol. 2016 Jul 12;8(7):2076-92. doi: 10.1093/gbe/evw132. Genome Biol Evol. 2016. PMID: 27289096 Free PMC article.
-
Pairs of Adjacent Conserved Noncoding Elements Separated by Conserved Genomic Distances Act as Cis-Regulatory Units.Genome Biol Evol. 2018 Sep 1;10(9):2535-2550. doi: 10.1093/gbe/evy196. Genome Biol Evol. 2018. PMID: 30184074 Free PMC article.
-
The Dynamics, Causes, and Impacts of Mammalian Evolutionary Rates Revealed by the Analyses of Capybara Draft Genome Sequences.Genome Biol Evol. 2020 Aug 1;12(8):1444-1458. doi: 10.1093/gbe/evaa157. Genome Biol Evol. 2020. PMID: 32835375 Free PMC article.
References
-
- Ahituv N, Rubin EM, Nobrega MA. Exploiting human–fish genome comparisons for deciphering gene regulation. Hum Mol Genet. 2004;13:R261–R266. - PubMed
-
- Aparicio S, et al. Whole-genome shotgun assembly and analysis of the genome of Fugu rubripes. Science. 2002;297:1301–1310. - PubMed
-
- Beissbarth T, Speed TP. GOstat: find statistically overrepresented Gene Ontologies within a group of genes. Bioinformatics. 2004;20:1464–1465. - PubMed
-
- Bejerano G, et al. Ultraconserved elements in the human genome. Science. 2004;304:1321–1325. - PubMed
Publication types
MeSH terms
LinkOut - more resources
Full Text Sources
