. 2012 Apr 24;109(17):6602-7.
doi: 10.1073/pnas.1203333109. Epub 2012 Apr 13.

Reassessment of the 2010-2011 Haiti cholera outbreak and rainfall-driven multiseason projections

Affiliations

Reassessment of the 2010-2011 Haiti cholera outbreak and rainfall-driven multiseason projections

Andrea Rinaldo et al. Proc Natl Acad Sci U S A. .

Abstract

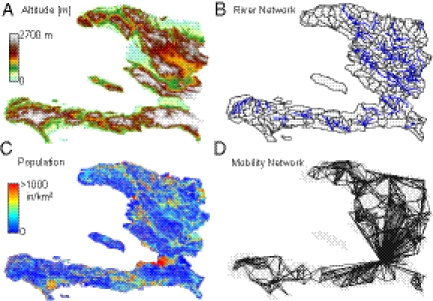
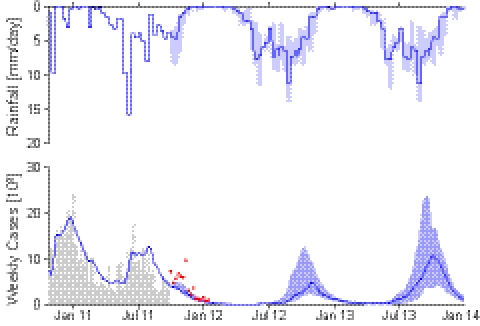
Mathematical models can provide key insights into the course of an ongoing epidemic, potentially aiding real-time emergency management in allocating health care resources and by anticipating the impact of alternative interventions. We study the ex post reliability of predictions of the 2010-2011 Haiti cholera outbreak from four independent modeling studies that appeared almost simultaneously during the unfolding epidemic. We consider the impact of different approaches to the modeling of spatial spread of Vibrio cholerae and mechanisms of cholera transmission, accounting for the dynamics of susceptible and infected individuals within different local human communities. To explain resurgences of the epidemic, we go on to include waning immunity and a mechanism explicitly accounting for rainfall as a driver of enhanced disease transmission. The formal comparative analysis is carried out via the Akaike information criterion (AIC) to measure the added information provided by each process modeled, discounting for the added parameters. A generalized model for Haitian epidemic cholera and the related uncertainty is thus proposed and applied to the year-long dataset of reported cases now available. The model allows us to draw predictions on longer-term epidemic cholera in Haiti from multiseason Monte Carlo runs, carried out up to January 2014 by using suitable rainfall fields forecasts. Lessons learned and open issues are discussed and placed in perspective. We conclude that, despite differences in methods that can be tested through model-guided field validation, mathematical modeling of large-scale outbreaks emerges as an essential component of future cholera epidemic control.


Conflict of interest statement

The authors declare no conflict of interest.

Figures

Fig. 1.
Fig. 1.
(Top) Daily decadal rainfall intensity, averaged over the entire Haiti region (SI Materials and Methods). (Middle) Weekly reported cases (1) (gray bars) compared with the simulated incidence pattern (solid line) computed by the model in ref. . Data from each department were collected until September 30, 2011. The calibration dataset (dark gray) was limited to the total reported cases available until December 2010. The solid line shows the published early prediction (7) that was run until the end of May 2011. To facilitate the assessment, we have now extended the original prediction to the end of September 2011 (dashed line). (Bottom) Simulated and reported weekly cumulated cases.
Fig. 2.
Fig. 2.
(A) Color-coded digital terrain elevation map (DTM) of Haiti; (B) the subdivision of Haitian territory in hydrological units (subbasins) extracted from the DTM, as a result of the convergence of several geomorphological criteria (SI Materials and Methods); (C) spatial distribution of population density obtained by LandScan remote sensing, which is translated into a geo-referenced spatial distribution of nodes formula image endowed with population formula image (SI Materials and Methods); (D) A relevant subset of the network of human mobility, here portrayed synthetically by the four largest outbound connections for each node.
Fig. 3.
Fig. 3.
Simulated evolution of the Haiti epidemic cholera from October 2010 to September 2011 by the revised complete model that includes bursts of infections caused by pathogen loads brought into the water reservoir by hydrologic washout. The final choice follows from the ranking of the performances of different candidate models according to Akaike's information criterion (40). (Upper) Weekly cumulated reported cases are visualized as the sum of the reported cases in each department (gray bars), fitted by the simulation of the revised model at the department level (blue solid line). The performance of the model at the department level is also shown (blue solid lines). (Inset) Haitian departments are listed as follows: 1, Nord-Ouest; 2, Nord; 3, Nord-Est; 4, Artibonite; 5, Centre; 6, Grand-Anse; 7, Nippes; 8, Ouest; 9, Sud; and 10, Sud-Est. (Lower) Evolution of reported new weekly cases (gray bars) along with the simulated incidence pattern of the revised model (solid line). Error bars highlight the range of uncertainty due to parameter estimation (described in detail in SI Materials and Methods). See also animation Movie S1.
Fig. 4.
Fig. 4.
Multiseasonal evolution of Haiti epidemic cholera (from October 2010 to January 2014) simulated by the best-performing model. Reported new weekly cases (gray bars) are shown along with the simulated incidence pattern (solid line). (Upper) Rainfall is predicted starting from October 1, 2011. The range of uncertainty due to the uncertainty in rainfall forecast (SI Materials and Methods) is highlighted by the shading. Red dots highlight cases reported after September and not used for calibration. Note the agreement between the epidemic fading in the data and the model projection, with the exception of an unpredicted infections peak in the late Fall of 2011. This exception is likely explained by the extreme rainfall events that occurred in the first decade of October that were missed by the rainfall patterns projected from the end of September.

References

    1. Pan American Health Organization Haiti cholera outbreak data. 2011. Available at http://new.paho.org/hq/images/Atlas_IHR/CholeraHispaniola/atlas.html. Accessed December 10, 2011.
    1. Butler D. Cholera tightens grip on Haiti. Nature. 2010;468:483–484. - PubMed
    1. Walton DA, Ivers LC. Responding to cholera in post-earthquake Haiti. N Engl J Med. 2011;364:3–5. - PubMed
    1. Sack DA. How many cholera deaths can be averted in Haiti? Lancet. 2011;377:1214–1216. - PubMed
    1. Friedrich MJ. Haiti cholera outbreak. JAMA. 2011;305:2402.

Publication types