. 2012 Mar;32(2):601-607.
doi: 10.1016/j.apgeog.2011.07.009. Epub 2011 Aug 10.

Geographic influences on sexual and reproductive health service utilization in rural Mozambique

Affiliations

Geographic influences on sexual and reproductive health service utilization in rural Mozambique

Jing Yao et al. Appl Geogr. 2012 Mar.

Abstract

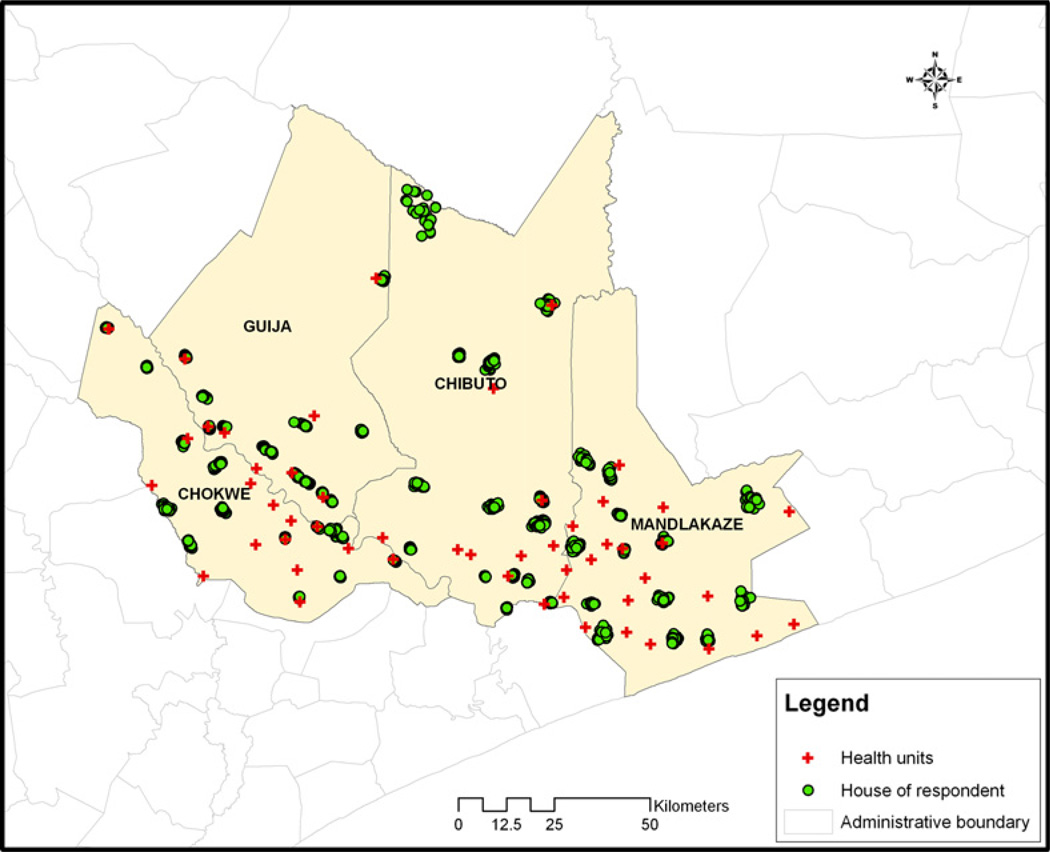
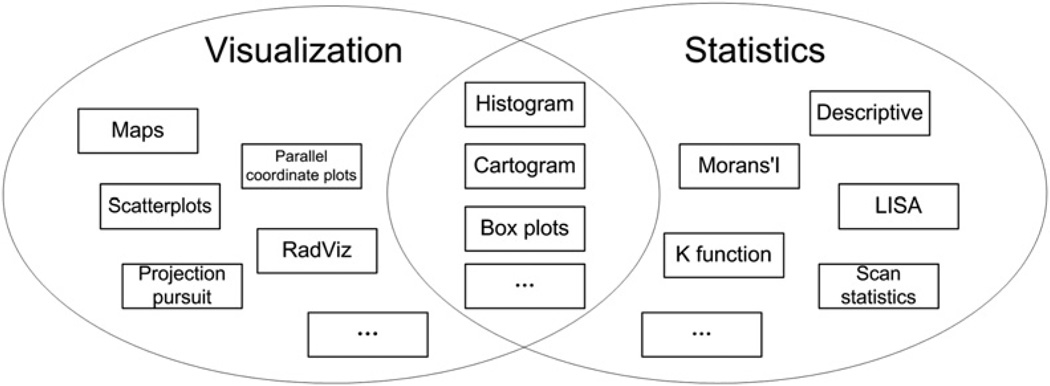
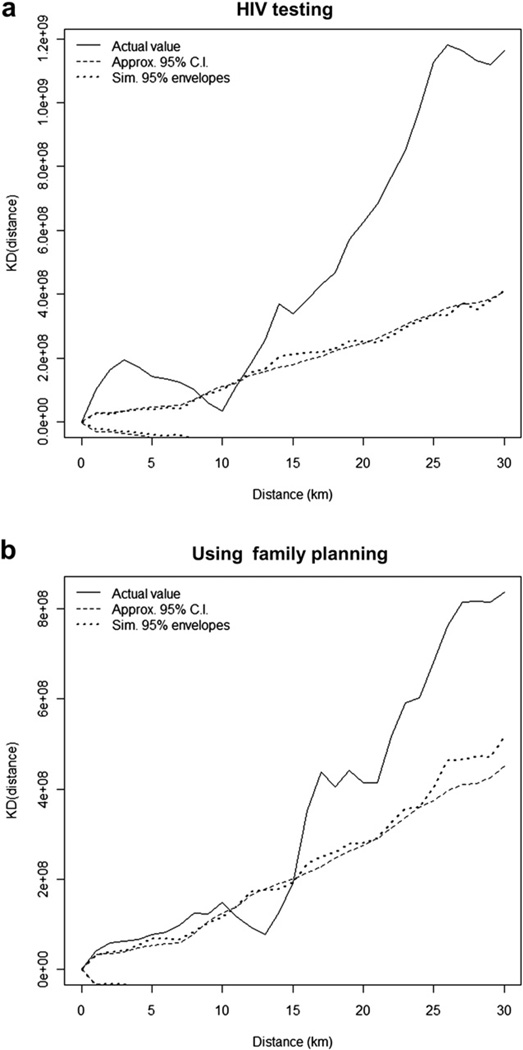
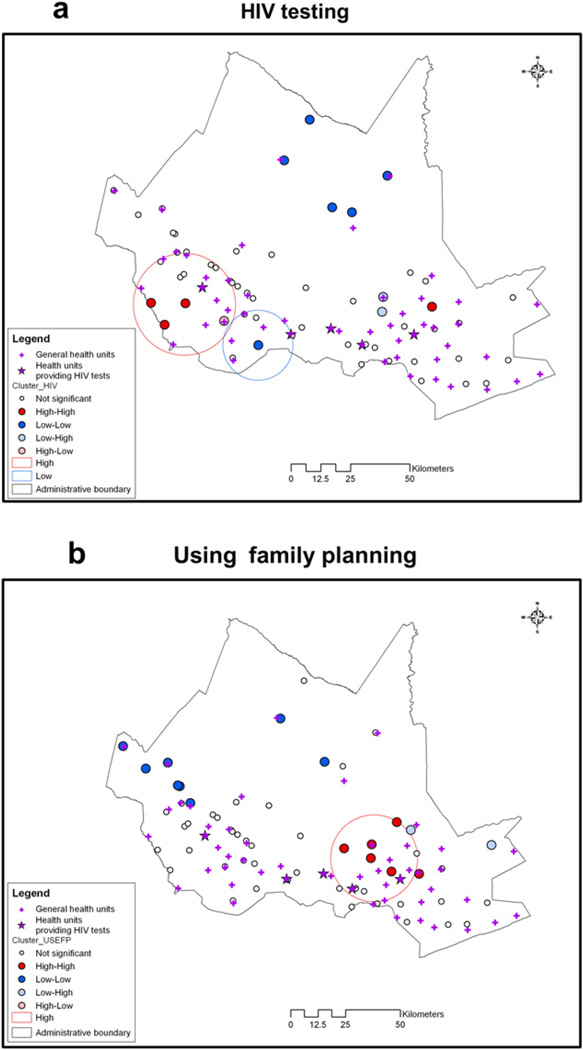
The HIV/AIDS epidemic remains a major public health issue across the globe, and it is of particular concern in sub-Saharan Africa. Utilization of sexual and reproductive health (SRH) services can significantly impact HIV prevention, transmission, and treatment. SRH service utilization may be determined by individual characteristics, such as education and economic status, but also by the location and accessibility of health care facilities. Using population-based survey data, this study applies exploratory spatial analysis techniques to examine spatial patterns of SRH service utilization among rural married women in southern Mozambique. Clustering among those using services is found as are spatial associations, indicating significant spatial variability in the utilization of health services. The findings provide valuable insights for current and future health care program planning and configuration.


Figures

Fig. 1
Fig. 1. Study Area
This figure describes the study area, the location of respondents and the health units.
Fig. 2
Fig. 2. ESDA Overview
ESDA is primarily comprised of two important components: visualization and statistics. Tools of visualization include maps, scatterplots, RadViz (a method mapping high-dimensional data onto two dimensional space) and projection pursuit (a technique finding projections that can reveal structures in high-dimensional data), etc. Common statistics include basic descriptive, Moran’s I, and LISA. In addition, some elements are in the intersection of those two parts, such as histogram and cartogram.
Fig. 3
Fig. 3. Differences of K Functions
This figure describes the differences of K functions for the two outcomes. Both outcomes have a similar spatial pattern, indicating significant clustering at smaller (less than 8 km in (a) and 10 km in (b)) or larger distances (larger than 12 km in (a) and 15 km in (b)) where estimated values are larger than those from a random distribution. No significant clustering is found in intermediate distances ([8 km, 12 km] in (a) and [10 km, 15 km] in (b)) as the curve of actual values falls within the confidence bands.
Fig. 4
Fig. 4. Local Cluster Maps
The circles are clusters from spatial scan statistic, where red circles are high value clusters and blue circles are low value clusters. The dots are village-level cluster centers from LISA analysis, where red dots are high–high cluster centers and blue dots are low–low cluster centers. (For interpretation of the references to color in this figure legend, the reader is referred to the web version of this article.)

References

    1. Acharya LB, Cleland J. Maternal and child health services in rural Nepal: does access or quality matter more? Health Policy and Planning. 2000;15(2):223–229. - PubMed
    1. Agadjanian V, Arnaldo C, Cau B. Health costs of wealth gains: labor migration and perceptions of HIV/AIDS risks in Mozambique. Social Forces. 2011;89(4):1097–1117. - PMC - PubMed
    1. Agadjanian V, Yabiku ST, Cau B. Men’s migration and women’s fertility in rural Mozambique. Demography. 2011;48(3):1029–1048. - PMC - PubMed
    1. Anselin L. Exploratory spatial data analysis and geographic information systems. In: Painho M, editor. New tools for spatial analysis. Luxembourg: Eurostat; 1994. pp. 45–54.
    1. Anselin L. Local indicators of spatial association - LISA. Geographical Analysis. 1995;27:93–115.

LinkOut - more resources