Foraging fidelity as a recipe for a long life: foraging strategy and longevity in male Southern Elephant Seals
- PMID: 22505993
- PMCID: PMC3323586
- DOI: 10.1371/journal.pone.0032026
Foraging fidelity as a recipe for a long life: foraging strategy and longevity in male Southern Elephant Seals
Abstract
Identifying individual factors affecting life-span has long been of interest for biologists and demographers: how do some individuals manage to dodge the forces of mortality when the vast majority does not? Answering this question is not straightforward, partly because of the arduous task of accurately estimating longevity in wild animals, and of the statistical difficulties in correlating time-varying ecological covariables with a single number (time-to-event). Here we investigated the relationship between foraging strategy and life-span in an elusive and large marine predator: the Southern Elephant Seal (Mirounga leonina). Using teeth recovered from dead males on îles Kerguelen, Southern Ocean, we first aged specimens. Then we used stable isotopic measurements of carbon (δ13C) in dentin to study the effect of foraging location on individual life-span. Using a joint change-point/survival modelling approach which enabled us to describe the ontogenetic trajectory of foraging, we unveiled how a stable foraging strategy developed early in life positively covaried with longevity in male Southern Elephant Seals. Coupled with an appropriate statistical analysis, stable isotopes have the potential to tackle ecological questions of long standing interest but whose answer has been hampered by logistic constraints.
Conflict of interest statement
Figures

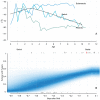
 but changes to a bimodal distribution afterwards. Observations belonging to the component with the smallest mean are first in a minority but progressively increase in proportion until becoming the majority.
 % Highest Probability Density (HPD) intervals are depicted. For advanced age classes (
 years), this model suggested an increase in mean
  values for Subantartic foragers, and a decrease for Antarctic foragers. This effect seems artefactual in light of Figure 1 where isotopic values are stable after age
  . The artefact results from the restrictive assumption on the growth curve shape (see Methods).

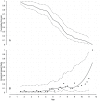
 % confidence interval. The lower panel illustrates the empirical hazard ratio, along with a loess curve (continuous black line): the assumption of a monotonic hazard is reasonable as hazards are ever increasing.
  % confidence intervals (dashed lines) for the empirical hazard ratio are also represented: these intervals widen with age as the number of individuals at risk decreases in advanced age classes.
References
-
- Beeton M, Pearson K. On the Inheritance of the Duration of Life, and on the Intensity of Natural Selection in Man. Biometrika. 1901;1:50–89.
-
- Kannisto V. Frailty and Survival. Genus. 2001;47:101–118. - PubMed
-
- Thomson D, Cooch E, Conroy M. Modeling Demographic Processes in Marked Populations. 2009. Springer, 1st edition.
-
- Wasser D, Sherman P. Avian Longevities and Their Interpretation under Evolutionary Theories of Senescence. Journal of Zoology. 2010;280:103–155.
Publication types
MeSH terms
Substances
LinkOut - more resources
Full Text Sources

