

Gene regulation of intestinal porcine epithelial cells IPEC-J2 is dependent on the site of deoxynivalenol toxicological action
- PMID: 22506013
- PMCID: PMC3323619
- DOI: 10.1371/journal.pone.0034136
Gene regulation of intestinal porcine epithelial cells IPEC-J2 is dependent on the site of deoxynivalenol toxicological action
Abstract
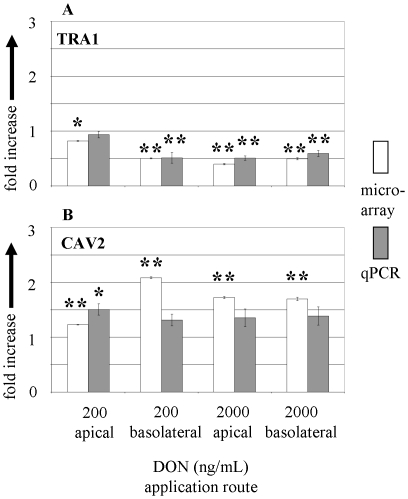
The intestinal epithelial cell layer represents the border between the luminal and systemic side of the gut. The decision between absorption and exclusion of substances is the quintessential function of the gut and varies along the gut axis. Consequently, potentially toxic substances may reach the basolateral domain of the epithelial cell layer via blood stream. The mycotoxin deoxynivalenol (DON) is a Fusarium derived secondary metabolite known to enter the blood stream and displaying a striking toxicity on the basolateral side of polarised epithelial cell layers in vitro. Here we analysed potential mechanisms of apical and basolateral DON toxicity reflected in the gene expression. We used the jejunum-derived, polarised intestinal porcine epithelial cell line IPEC-J2 as an in vitro cell culture model. Luminal and systemic DON challenge of the epithelial cell layer was mimicked by a DON application from the apical or basolateral compartment of membrane inserts for 72 h. We compared the genome-wide gene expression of untreated and DON-treated IPEC-J2 cells with the GeneChip® Porcine Genome Array of Affymetrix. Low basolateral DON (200 ng/mL) application triggered 10 times more gene transcripts in comparison to the corresponding apical application (2539 versus 267) despite the intactness of the challenged cell layer as measured by transepithelial electrical resistance. Analysis of the regulated genes by bioinformatic resource DAVID identified several groups of biochemical pathways modulated by concentration and orientation of DON application. Selected genes representing pathways of the cellular metabolism, information processing and structural design were analysed in detail by quantitative PCR. Our findings clearly show that apical and basolateral challenge of epithelial cell layers trigger different gene response profiles paralleled with a higher susceptibility towards basolateral challenge. The evaluation of toxicological potentials of mycotoxins should take this difference in gene regulation dependent on route of application into account.
Conflict of interest statement
Figures


Similar articles
-
Vulnerability of polarised intestinal porcine epithelial cells to mycotoxin deoxynivalenol depends on the route of application.PLoS One. 2011 Feb 25;6(2):e17472. doi: 10.1371/journal.pone.0017472. PLoS One. 2011. PMID: 21364771 Free PMC article.
-
Deoxynivalenol, but not E. coli lipopolysaccharide, changes the response pattern of intestinal porcine epithelial cells (IPEC-J2) according to its route of application.Toxicol Lett. 2015 Dec 15;239(3):161-71. doi: 10.1016/j.toxlet.2015.09.019. Epub 2015 Sep 28. Toxicol Lett. 2015. PMID: 26417708
-
Porcine intestinal epithelial barrier disruption by the Fusarium mycotoxins deoxynivalenol and T-2 toxin promotes transepithelial passage of doxycycline and paromomycin.BMC Vet Res. 2012 Dec 17;8:245. doi: 10.1186/1746-6148-8-245. BMC Vet Res. 2012. PMID: 23244712 Free PMC article.
-
Impacts of the feed contaminant deoxynivalenol on the intestine of monogastric animals: poultry and swine.J Appl Toxicol. 2015 Apr;35(4):327-37. doi: 10.1002/jat.3083. Epub 2014 Oct 28. J Appl Toxicol. 2015. PMID: 25352520 Review.
-
Porcine IPEC-J2 intestinal epithelial cells in microbiological investigations.Vet Microbiol. 2012 May 4;156(3-4):229-37. doi: 10.1016/j.vetmic.2011.10.017. Epub 2011 Oct 20. Vet Microbiol. 2012. PMID: 22074860 Free PMC article. Review.
Cited by
-
Effects of Deoxynivalenol and Mycotoxin Adsorbent Agents on Mitogen-Activated Protein Kinase Signaling Pathways and Inflammation-Associated Gene Expression in Porcine Intestinal Epithelial Cells.Toxins (Basel). 2021 Apr 23;13(5):301. doi: 10.3390/toxins13050301. Toxins (Basel). 2021. PMID: 33922863 Free PMC article.
-
Mycotoxin Deoxynivalenol Has Different Impacts on Intestinal Barrier and Stem Cells by Its Route of Exposure.Toxins (Basel). 2020 Sep 24;12(10):610. doi: 10.3390/toxins12100610. Toxins (Basel). 2020. PMID: 32987679 Free PMC article.
-
Protective effects of biological feed additives on gut microbiota and the health of pigs exposed to deoxynivalenol: a review.J Anim Sci Technol. 2022 Jul;64(4):640-653. doi: 10.5187/jast.2022.e40. Epub 2022 Jul 31. J Anim Sci Technol. 2022. PMID: 35969702 Free PMC article. Review.
-
Deoxynivalenol affects cell metabolism in vivo and inhibits protein synthesis in IPEC-1 cells.Mycotoxin Res. 2023 Aug;39(3):219-231. doi: 10.1007/s12550-023-00489-z. Epub 2023 May 31. Mycotoxin Res. 2023. PMID: 37256505 Free PMC article.
-
Penetration of fosfomycin into IPEC-J2 cells in the presence or absence of deoxynivalenol.PLoS One. 2013 Sep 6;8(9):e75068. doi: 10.1371/journal.pone.0075068. eCollection 2013. PLoS One. 2013. PMID: 24040387 Free PMC article.
References
-
- Dänicke S, Valenta H, Döll S. On the toxicokinetics and the metabolism of deoxynivalenol (DON) in the pig. Arch Anim Nutr. 2004;58:169–180. - PubMed
-
- Mariani V, Palermo S, Fiorentini S, Lanubile A, Giuffra E. Gene expression study of two widely used pig intestinal epithelial cell lines: IPEC-J2 and IPI-2I. Vet Immunol Immunopathol. 2009;131:278–284. - PubMed
-
- Schierack P, Nordhoff M, Pollmann M, Weyrauch KD, Amasheh S, et al. Characterization of a porcine intestinal epithelial cell line for in vitro studies of microbial pathogenesis in swine. Histochem Cell Biol. 2006;125:293–305. - PubMed
Publication types
MeSH terms
Substances
LinkOut - more resources
Full Text Sources
Molecular Biology Databases
