. 2012;7(4):e35109.
doi: 10.1371/journal.pone.0035109. Epub 2012 Apr 10.

GABA(A) receptors containing the α2 subunit are critical for direction-selective inhibition in the retina

Affiliations

GABA(A) receptors containing the α2 subunit are critical for direction-selective inhibition in the retina

Olivia Nicola Auferkorte et al. PLoS One. 2012.

Abstract

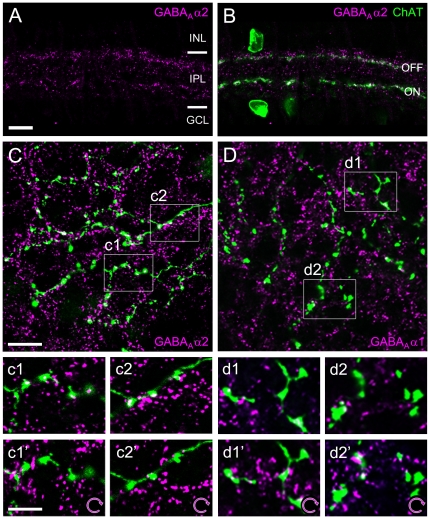
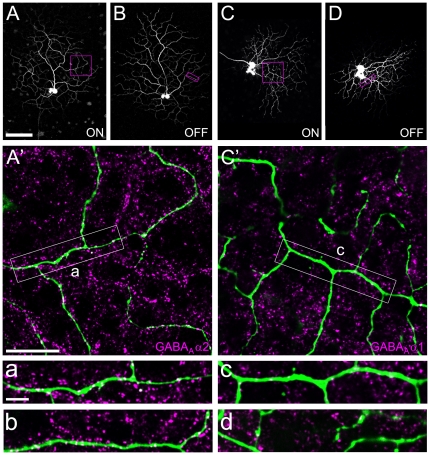
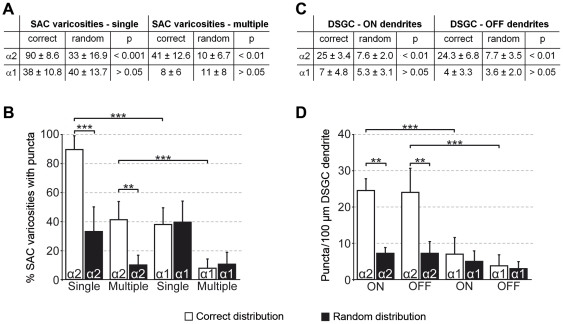
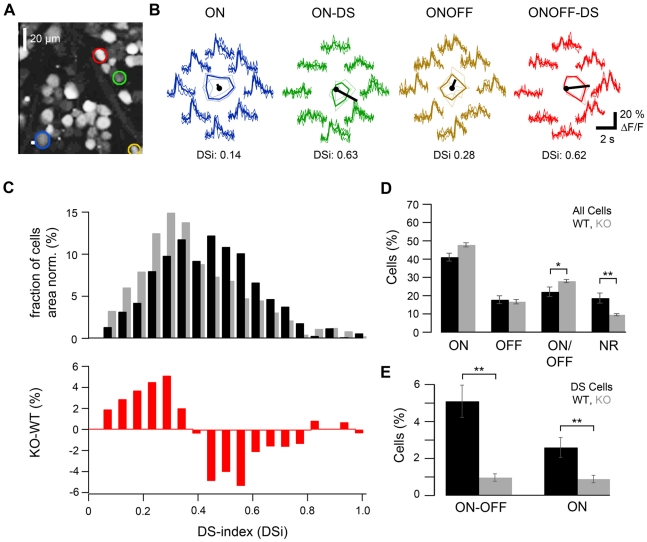
Far from being a simple sensor, the retina actively participates in processing visual signals. One of the best understood aspects of this processing is the detection of motion direction. Direction-selective (DS) retinal circuits include several subtypes of ganglion cells (GCs) and inhibitory interneurons, such as starburst amacrine cells (SACs). Recent studies demonstrated a surprising complexity in the arrangement of synapses in the DS circuit, i.e. between SACs and DS ganglion cells. Thus, to fully understand retinal DS mechanisms, detailed knowledge of all synaptic elements involved, particularly the nature and localization of neurotransmitter receptors, is needed. Since inhibition from SACs onto DSGCs is crucial for generating retinal direction selectivity, we investigate here the nature of the GABA receptors mediating this interaction. We found that in the inner plexiform layer (IPL) of mouse and rabbit retina, GABA(A) receptor subunit α2 (GABA(A)R α2) aggregated in synaptic clusters along two bands overlapping the dendritic plexuses of both ON and OFF SACs. On distal dendrites of individually labeled SACs in rabbit, GABA(A)R α2 was aligned with the majority of varicosities, the cell's output structures, and found postsynaptically on DSGC dendrites, both in the ON and OFF portion of the IPL. In GABA(A)R α2 knock-out (KO) mice, light responses of retinal GCs recorded with two-photon calcium imaging revealed a significant impairment of DS responses compared to their wild-type littermates. We observed a dramatic drop in the proportion of cells exhibiting DS phenotype in both the ON and ON-OFF populations, which strongly supports our anatomical findings that α2-containing GABA(A)Rs are critical for mediating retinal DS inhibition. Our study reveals for the first time, to the best of our knowledge, the precise functional localization of a specific receptor subunit in the retinal DS circuit.


Conflict of interest statement

Competing Interests: The authors have declared that no competing interests exist.

Figures

Figure 1
Figure 1. Localization of candidate GABAAR receptor subunits in relation to SAC dendrites and varicosities.
A–B. Immunolabeling pattern of the GABAAR α2 subunit (magenta) in a vertical section of rabbit retina (single optical section; INL, inner nuclear layer; IPL, inner plexiform layer; GCL, ganglion cell layer). Starburst amacrine cells (SACs) were labeled against choline acetyltransferase (ChAT, green). ON SACs have somata in the GCL and their dendrites form the inner ChAT band; OFF SACs are located in the INL and their dendrites form the outer band. Synaptic receptor clusters (magenta) are unevenly distributed across the neuropile, with GABAAR α2 puncta concentrating in two bands along the SAC processes. C. Distal dendrites of a SAC injected with Neurobiotin (green) and co-stained with GABAAR α2 antibody (magenta) (single optical section): the majority of SAC varicosities are associated with receptor staining. Examples for such association are illustrated at higher magnification: c1 and c2 show observed receptor distribution, c1′ and c2′ show randomized control (magenta channel rotated 90° clockwise). Significantly fewer varicosities are associated with receptor clusters in the rotated control. D. Distal dendrites (green) of a SAC injected as in C but co-stained with GABAAR α1 (magenta) (single optical section): Some varicosities are associated with receptor clusters (see also magnifications in d1–d2). No obvious change in the degree of signal overlap is seen for the randomized control (d1′ and d2′). Scale bars: A, 10 µm (applies also to B); C, 10 µm (applies also to D); c1, 5 µm (applies to all insets).
Figure 2
Figure 2. Localization of candidate GABAAR receptor subunits in relation to DSGC dendrites.
A–D. Collapsed confocal stacks of two morphologically identified Neurobiotin-injected DSGCs (ON and OFF arbors shown separately). A′. Magnification of dendrite (ON layer) of the cell shown in A–B (green), co-stained with antibodies against GABAAR α2 (magenta). Dendrites are covered with receptor puncta, as evident at higher magnification in examples from the ON (a) and the OFF layer (b). C′. Magnification of dendrite (ON layer) of the cell in C–D (green), co-stained with GABAAR α1 antibodies (magenta). Only occasional receptor staining is found along the dendrites, as shown at higher magnification in examples from the ON (c) and the OFF arbor (d). Scale bars: A, 100 µm (applies also to B–D); A′, 20 µm (applies also to C′); a, 5 µm (applies also to b–d).
Figure 3
Figure 3. Quantification of candidate GABAA receptor distribution on SACs and DSGCs.
A. GABAAR α2 and α1 puncta distribution in relation to SAC dendrites in percentages of varicosities associated with at least a single punctum (=receptor cluster) and with multiple puncta (α2, n=245 varicosities from 5 cells in 4 retinae; α1, n=181 varicosities from 5 cells in 3 retinae). Percentages and standard deviation values are given for the original data (correct distribution) and for data with one fluorescence channel rotated by 90° (random distribution). B. Percentages of varicosities associated with single or multiple puncta plotted for the correct distribution (open bars) and randomized controls (filled bars). C. GABAAR α2 and α1 puncta distribution in relation to DSGC dendrites in number of receptor clusters per 100 µm of dendritic length for both ON and OFF dendritic arbors (α2, n=3 cells from 3 retinae; α1, n=3 cells from 2 retinae). D. Number of receptor clusters in ON and OFF sublayers plotted for the original data (correct distribution, open bars) and the randomized controls (random distribution, filled bars). Average and standard deviation values plotted in this figure were determined across cells.
Figure 4
Figure 4. Analysis of DS responses in GABAAR α2 knock-out mice and wild-type animals.
A. Two-photon micrograph showing an optical section (110×110 µm2, at the level of the GCL) of mouse retina, with 56 ganglion cells (and displaced amacrine cells) stained by the calcium indicator dye OGB-1 via electroporation. B. Calcium responses (ΔF/F) evoked by a bar stimulus moving in 8 directions measured in four exemplary GCs (trace color matches color of ROIs [regions of interest] in A): an ON (blue), an ON-DS (green), an ON-OFF (yellow) and an ON-OFF-DS (red) ganglion cell. Polar plots of the response amplitudes, with the preferred direction (black line) indicated, are shown in the center of the traces and reflect the different DS tuning strength of the cells (see also direction selectivity index, DSi; for definition see Methods ). C. Histogram (top) showing the DSi distribution across all recorded GCL cells in GABAAR α2 knock-out mice (gray bars, n=2553 cells in 2 mice) and wild-type controls (black bars, n=1002 cells in 4 mice). Bottom: Difference between histograms (from top), illustrating the drop in the number of cells with higher DS-indices. D. Percentage of ON, OFF, ON-OFF, as well as non-responsive (NR) GCL cells in control (black bars) and knock-out animals (gray bars). E. ON-OFF and ON cells with a DSi>0.4 in the two groups of animals (cells were included or rejected after manual inspection of responses; see Results for complete criteria). (For E and D, relative cell type numbers were determined for each of the recorded GCL field –18 fields in wild-type, 30 in knock-out mice; with approx. 50–60 cells each– and then averaged; error bars indicate S.E.M.).

References

    1. Barlow HB, Hill RM. Selective sensitivity to direction of movement in ganglion cells of the rabbit retina. Science. 1963;139:412–414. - PubMed
    1. Barlow HB, Hill RM, Levick WR. Retinal Ganglion Cells Responding Selectively to Direction and Speed of Image Motion in the Rabbit. J Physiol. 1964;173:377–407. - PMC - PubMed
    1. Amthor FR, Oyster CW, Takahashi ES. Morphology of on-off direction-selective ganglion cells in the rabbit retina. Brain Res. 1984;298:187–190. - PubMed
    1. Amthor FR, Takahashi ES, Oyster CW. Morphologies of rabbit retinal ganglion cells with complex receptive fields. J Comp Neurol. 1989;280:97–121. - PubMed
    1. Oyster CW, Barlow HB. Direction-selective units in rabbit retina: distribution of preferred directions. Science. 1967;155:841–842. - PubMed

Publication types