

Trends in Chinese snacking behaviors and patterns and the social-demographic role between 1991 and 2009
- PMID: 22507613
- PMCID: PMC3335772
Trends in Chinese snacking behaviors and patterns and the social-demographic role between 1991 and 2009
Abstract
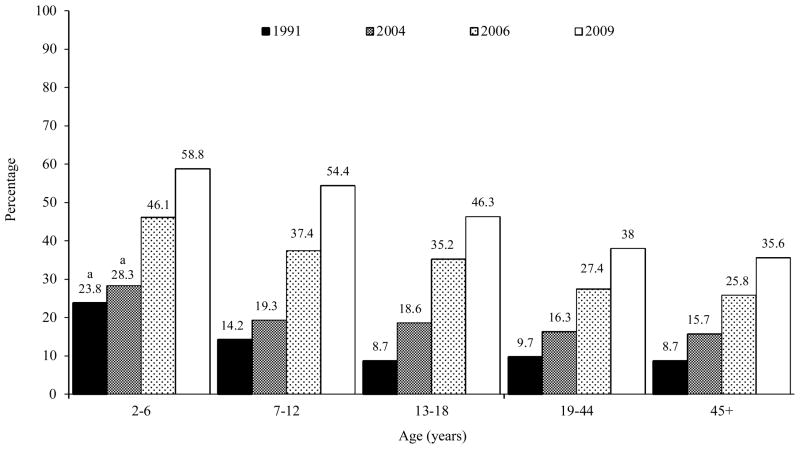
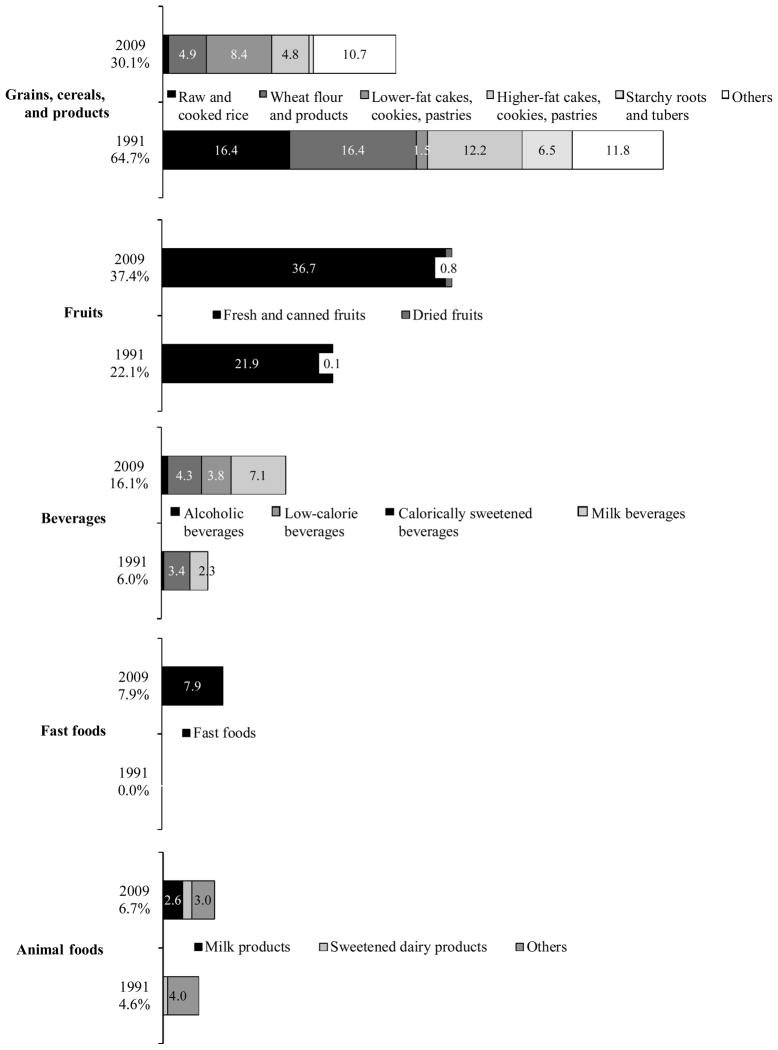
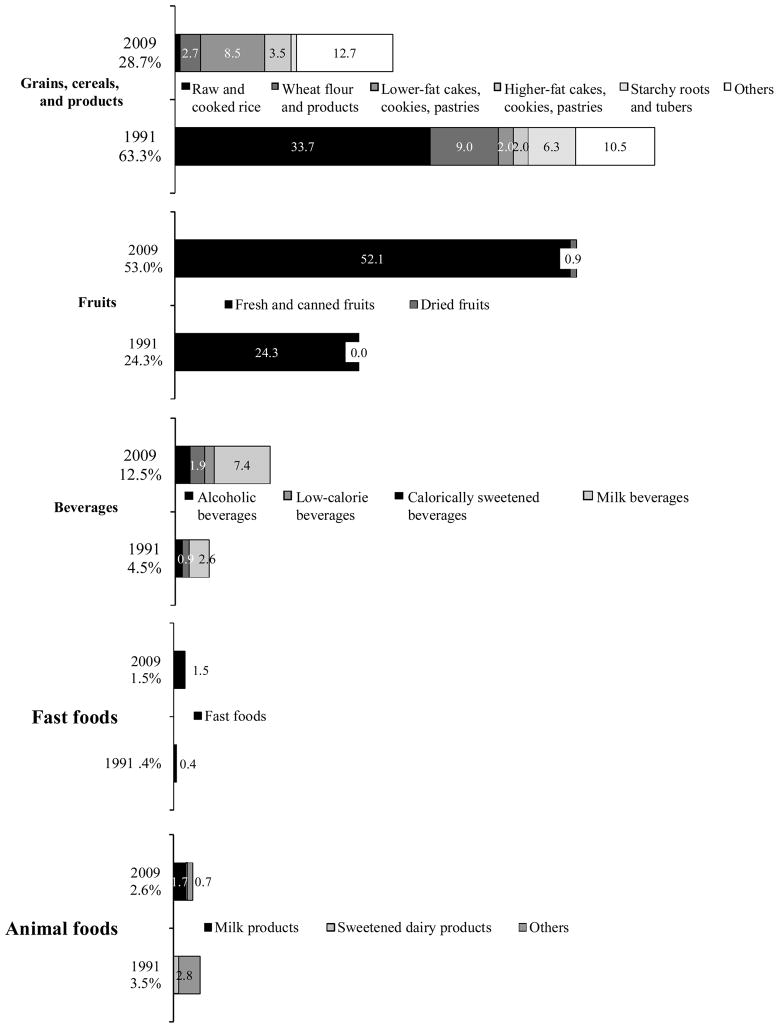
This study investigates the dynamic shifts in snacking behaviors and patterns in China. Using four waves (1991, 2004, 2006, and 2009) from the China Health and Nutrition Survey (CHNS), with full socioeconomic and demographic data and 3-day, 24-hour dietary recall data, 45,402 individuals age two and older were studied. Multiple logistic regressions were performed to examine the association of social-demographic factors on snacking behaviors. Results show that snacking prevalence, frequency of daily snacking occasions, and percentage of total daily energy intake (EI) from snacks increased significantly across all ages between 1991 and 2009, with a dramatic increase after 2004. Snacking was much more prevalent among children and higher-income, urban, and educated populations over time. Evening was the preferred snacking occasion, and the proportion of total daily EI from snacks varied between 4.1% and 12.3% for all snackers. Fruits, grains, and beverages were the most popular snacks and the highest contributors to snacking EI over all age groups. A marked transition from a tradition of two or three meals per day toward meals combined with snacks is underway. Further research is needed to develop a better understanding of the nutritional implications of Chinese snacking behaviors.
Figures
References
-
- Kerr MA, Rennie KL, McCaffrey TA, Wallace JM, Hannon-Fletcher MP, Livingstone MB. Snacking patterns among adolescents: a comparison of type, frequency and portion size between Britain in 1997 and Northern Ireland in 2005. Br J Nutr. 2009;101:122–31. - PubMed
-
- Phillips SM, Bandini LG, Naumova EN, Cyr H, Colclough S, Dietz WH, Must A. Energy-dense snack food intake in adolescence: longitudinal relationship to weight and fatness. Obes Res. 2004;12:461–72. - PubMed
-
- Huang TT, Howarth NC, Lin BH, Roberts SB, McCrory MA. Energy intake and meal portions: associations with BMI percentile in U.S. children. Obes Res. 2004;12:1875–85. - PubMed
-
- Field AE, Austin SB, Gillman MW, Rosner B, Rockett HR, Colditz GA. Snack food intake does not predict weight change among children and adolescents. Int J Obes Relat Metab Disord. 2004;28:1210–6. - PubMed
-
- Nicklas TA, Yang SJ, Baranowski T, Zakeri I, Berenson G. Eating patterns and obesity in children. The Bogalusa Heart Study. Am J Prev Med. 2003;25:9–16. - PubMed
Publication types
MeSH terms
Grants and funding
LinkOut - more resources
Full Text Sources
