

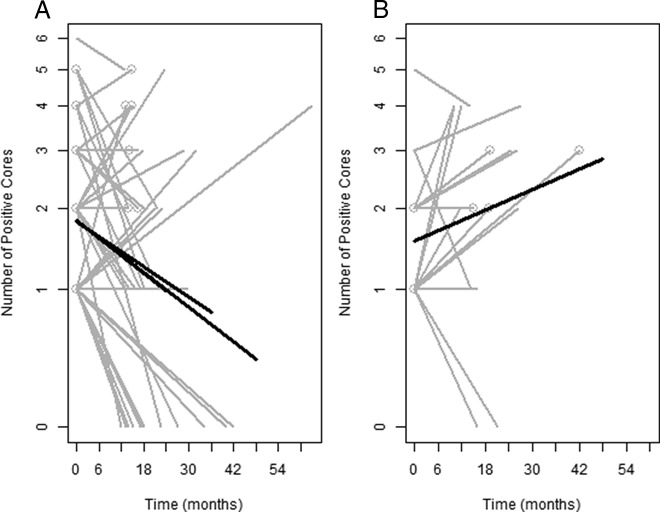
Vitamin D3 supplementation at 4000 international units per day for one year results in a decrease of positive cores at repeat biopsy in subjects with low-risk prostate cancer under active surveillance
- PMID: 22508710
- PMCID: PMC3387395
- DOI: 10.1210/jc.2012-1451
Vitamin D3 supplementation at 4000 international units per day for one year results in a decrease of positive cores at repeat biopsy in subjects with low-risk prostate cancer under active surveillance
Abstract
Context: We wanted to investigate vitamin D in low-risk prostate cancer.
Objectives: The objective of the study was to determine whether vitamin D(3) supplementation at 4000 IU/d for 1 yr is safe and would result in a decrease in serum levels of prostate-specific antigen (PSA) or in the rate of progression.
Design: In this open-label clinical trial (Investigational New Drug 77,839), subjects were followed up until repeat biopsy.
Setting: All subjects were enrolled through the Medical University of South Carolina and the Ralph H. Johnson Veterans Affairs Medical Center, both in Charleston, SC.
Patients and other participants: All subjects had a diagnosis of low-risk prostate cancer. Fifty-two subjects were enrolled in the study, 48 completed 1 yr of supplementation, and 44 could be analyzed for both safety and efficacy objectives.
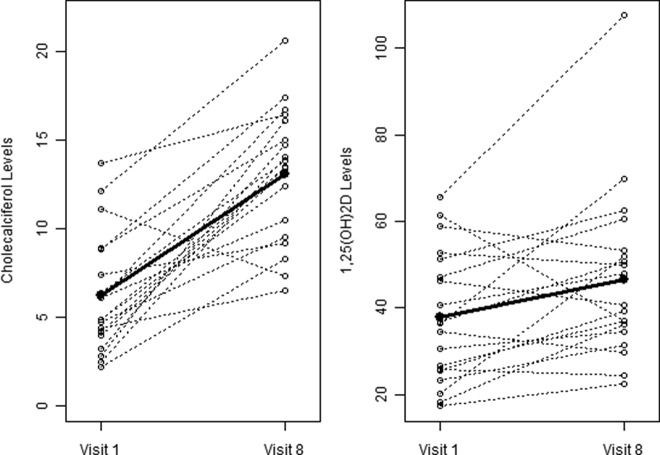
Intervention: The intervention included vitamin D(3) soft gels (4000 IU).
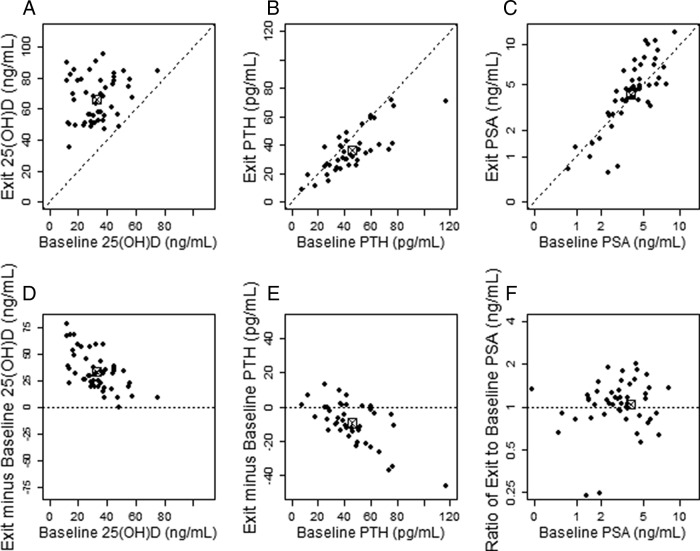
Main outcome measures: Adverse events were monitored throughout the study. PSA serum levels were measured at entry and every 2 months for 1 yr. Biopsy procedures were performed before enrollment (for eligibility) and after 1 yr of supplementation.
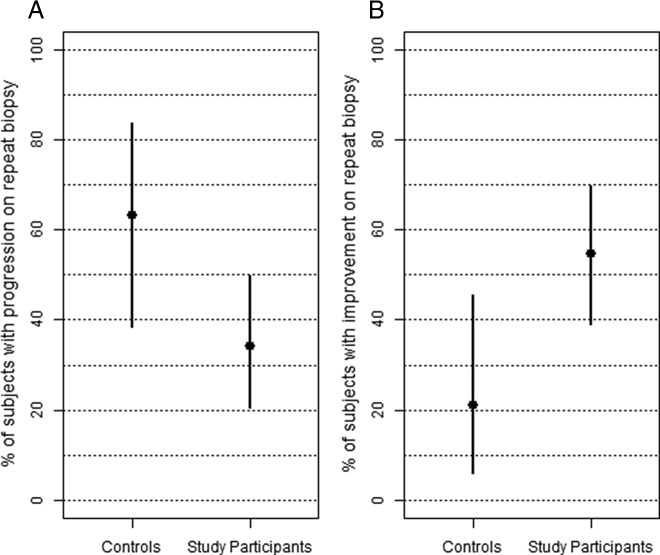
Results: No adverse events associated with vitamin D(3) supplementation were observed. No significant changes in PSA levels were observed. However, 24 of 44 subjects (55%) showed a decrease in the number of positive cores or decrease in Gleason score; five subjects (11%) showed no change; 15 subjects (34%) showed an increase in the number of positive cores or Gleason score.
Conclusion: Patients with low-risk prostate cancer under active surveillance may benefit from vitamin D(3) supplementation at 4000 IU/d.
Figures

Similar articles
-
Vitamin D3 supplementation, low-risk prostate cancer, and health disparities.J Steroid Biochem Mol Biol. 2013 Jul;136:233-7. doi: 10.1016/j.jsbmb.2012.11.012. Epub 2012 Dec 7. J Steroid Biochem Mol Biol. 2013. PMID: 23220550 Review.
-
Compliance Rates with the Prostate Cancer Research International Active Surveillance (PRIAS) Protocol and Disease Reclassification in Noncompliers.Eur Urol. 2015 Nov;68(5):814-21. doi: 10.1016/j.eururo.2015.06.012. Epub 2015 Jun 29. Eur Urol. 2015. PMID: 26138043
-
Correlative Analysis of Vitamin D and Omega-3 Fatty Acid Intake in Men on Active Surveillance for Prostate Cancer.Urology. 2021 Sep;155:110-116. doi: 10.1016/j.urology.2021.04.050. Epub 2021 Jun 16. Urology. 2021. PMID: 34144071
-
Randomized clinical trial of vitamin D3 doses on prostatic vitamin D metabolite levels and ki67 labeling in prostate cancer patients.J Clin Endocrinol Metab. 2013 Apr;98(4):1498-507. doi: 10.1210/jc.2012-4019. Epub 2013 Mar 5. J Clin Endocrinol Metab. 2013. PMID: 23463655 Free PMC article. Clinical Trial.
-
Systematic Review of Active Surveillance for Clinically Localised Prostate Cancer to Develop Recommendations Regarding Inclusion of Intermediate-risk Disease, Biopsy Characteristics at Inclusion and Monitoring, and Surveillance Repeat Biopsy Strategy.Eur Urol. 2022 Apr;81(4):337-346. doi: 10.1016/j.eururo.2021.12.007. Epub 2021 Dec 31. Eur Urol. 2022. PMID: 34980492
Cited by
-
Prostate cancer chemoprevention in men of African descent: current state of the art and opportunities for future research.Cancer Causes Control. 2013 Aug;24(8):1465-80. doi: 10.1007/s10552-013-0241-x. Epub 2013 Jun 5. Cancer Causes Control. 2013. PMID: 23737026 Free PMC article. Review.
-
The role of vitamin D in reducing cancer risk and progression.Nat Rev Cancer. 2014 May;14(5):342-57. doi: 10.1038/nrc3691. Epub 2014 Apr 4. Nat Rev Cancer. 2014. PMID: 24705652 Review.
-
Safety of 50,000-100,000 Units of Vitamin D3/Week in Vitamin D-Deficient, Hypercholesterolemic Patients with Reversible Statin Intolerance.N Am J Med Sci. 2016 Mar;8(3):156-62. doi: 10.4103/1947-2714.179133. N Am J Med Sci. 2016. PMID: 27114973 Free PMC article.
-
Controlling Chronic Diseases and Acute Infections with Vitamin D Sufficiency.Nutrients. 2023 Aug 18;15(16):3623. doi: 10.3390/nu15163623. Nutrients. 2023. PMID: 37630813 Free PMC article. Review.
-
A Systems Approach to Interrogate Gene Expression Patterns in African American Men Presenting with Clinically Localized Prostate Cancer.Cancers (Basel). 2021 Oct 14;13(20):5143. doi: 10.3390/cancers13205143. Cancers (Basel). 2021. PMID: 34680291 Free PMC article.
References
-
- Apperly FL. 1941. The relation of solar radiation to cancer mortality in North America. Cancer Res 1:191–195 - PubMed
-
- Reitsma PH, Rothberg PG, Astrin SM, Trial J, Bar-Shavit Z, Hall A, Teitelbaum SL, Kahn AJ. 1983. Regulation of myc gene expression in HL-60 leukaemia cells by a vitamin D metabolite. Nature 306:492–494 - PubMed
-
- Garland CF, Garland FC. 1980. Do sunlight and vitamin D reduce the likelihood of colon cancer? Int J Epidemiol 9:227–231 - PubMed
-
- Garland FC, Garland CF, Gorham ED, Young JF. 1990. Geographic variation in breast cancer mortality in the United States: a hypothesis involving exposure to solar radiation. Prev Med 19:614–622 - PubMed
Publication types
MeSH terms
Substances
Grants and funding
LinkOut - more resources
Full Text Sources
Other Literature Sources
Medical
Research Materials
Miscellaneous
