. 2012 Apr 15;26(8):830-45.
doi: 10.1101/gad.181685.111.

Mutant p53 cooperates with ETS2 to promote etoposide resistance

Affiliations

Mutant p53 cooperates with ETS2 to promote etoposide resistance

Phi M Do et al. Genes Dev. .

Abstract

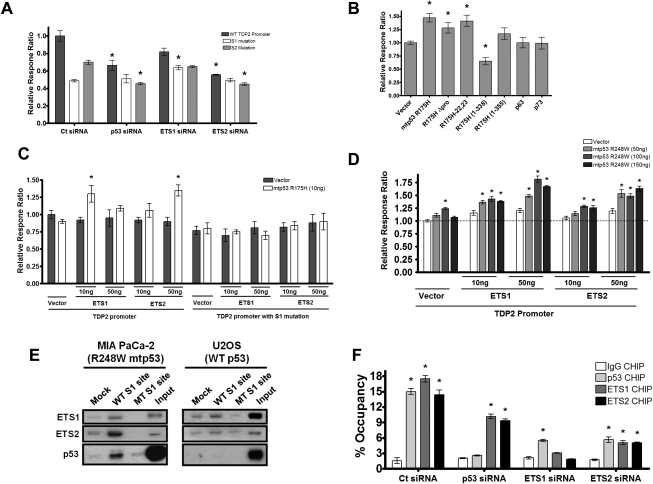
Mutant p53 (mtp53) promotes chemotherapy resistance through multiple mechanisms, including disabling proapoptotic proteins and regulating gene expression. Comparison of genome wide analysis of mtp53 binding revealed that the ETS-binding site motif (EBS) is prevalent within predicted mtp53-binding sites. We demonstrate that mtp53 regulates gene expression through EBS in promoters and that ETS2 mediates the interaction with this motif. Importantly, we identified TDP2, a 5'-tyrosyl DNA phosphodiesterase involved in the repair of DNA damage caused by etoposide, as a transcriptional target of mtp53. We demonstrate that suppression of TDP2 sensitizes mtp53-expressing cells to etoposide and that mtp53 and TDP2 are frequently overexpressed in human lung cancer; thus, our analysis identifies a potentially "druggable" component of mtp53's gain-of-function activity.


Figures

Figure 1.
Figure 1.
ChIP-on-chip and ChIP-seq analysis of mtp53 binding. (A) ChIP-on-chip and ChIP-seq analysis performed for mtp53 using MDAH087 cells revealed sites that were unique and common to both platforms. Analysis of ChIP-on-chip and ChIP-seq data revealed 1711 and 4393 mtp53-occupied promoters, with an overlap of 602 promoters. (B) Validation of 11 promoter regions predicted by ChIP-on-chip and ChIP-seq by qPCR showing relative occupancy compared with control IgG (mean ± SEM; [*] P-value ≤ 0.01 vs. IgG ChIP). The gene name listed represents the ORF nearest to the predicted mtp53-binding site. Change in expression of select genes after p53 knockdown in MDAH087 (C) and MIA PaCa-2 (D). Expression analysis by qPCR of the same 11 putative mtp53 target genes (and p53) was performed on cells transfected with either control (Ct) or p53 siRNA (mean ± SEM; [*] P-value ≤ 0.05 vs. control siRNA).
Figure 2.
Figure 2.
Motif alignment and binding prediction. (A) The EBS is the most overrepresented motif discovered in the MEME alignment. The 602 predicted mtp53-binding sites from the ChIP-seq data set alone were aligned using the MEME suite. The most overrepresented motif (GGAAR) was found to be highly specific for the ETS family of proteins' binding sites. (B) Analysis of the prevalence of EBSs in predicted mtp53-binding sites across different platforms. Further analysis of the ChIP-on-chip and ChIP-seq data sets revealed high prevalence of the MEME-discovered ETS motif within predicted mtp53-binding sites in both platforms; the motif accounts for 74.2% of ChIP-on-chip (1269 out of 1711), 44.9% of ChIP-seq (1973 out of 4393), and 50.0% of the overlapping promoters (301 out of 602). (C) Data mining of published ETS1 ChIP-seq data revealed a similar overlap of ETS1- and predicted mtp53-binding sites. By comparing our ChIP-on-chip and ChIP-seq data sets with ETS1 ChIP-seq data as reported by Hollenhorst et al. (2009), we demonstrated that a majority of our predicted mtp53 binding overlap ETS1 binding within ≤150 bp.
Figure 3.
Figure 3.
Interaction study of mtp53 and ETS proteins. Endogenous mtp53 can coimmunoprecipitate with ETS1 and ETS2 in MDAH087 (A) or MIA PaCa-2 (B) cell lysates. Cell lysates were immunoprecipitated using monoclonal antibodies for mtp53 and Western blot for ETS1, ETS2, and VDR using polyclonal antibodies. (C) Endogenous wild-type (WT) p53 can also interact with ETS2 in U2OS cells. U2OS cells were untreated (Unt) or treated with doxorubicin (DX) at a final concentration of 1 μg/mL for 6 h prior to harvesting for immunoprecipitation. Lysate were then immunoprecipitated using monoclonal antibodies against mtp53 and Western blot for ETS1, ETS2, and p53 using polyclonal antibodies. (D) In vitro interaction studies using recombinant wild-type p53, mtp53 R175H, mtp53 R248W, ETS1, and ETS2. Proteins were mixed in equal proportions and immunoprecipitated with either ETS1 or ETS2 antibodies. (E) Interaction of p53 with ETS1 and ETS2. H1299 cells were cotransfected with HA-tagged p53 (wild type or mutants) and myc-tagged ETS1 or ETS2 and coimmunoprecipitated with antibodies against HA or myc tags. (F) Schematic diagram demonstrating the localization of mtp53 and ETS2 protein–protein interaction regions. H1299 cells were transfected with plasmid DNA encoding the indicated protein/protein deletions. Lysates were coimmunoprecipitated with antibodies against p53 or Myc tag. (TA1) Transactivation domain 1; (Reg) regulatory domain; (TA2) transactivation domain 2; (ETS DBD) ETS DNA-binding domain; (TA) transactivation domain; (pro) proline-rich region; (Tet) tetramerization domain.
Figure 4.
Figure 4.
mtp53 cooperates with ETS2 to activate TDP2 expression. (A) Schematic of TDP2 promoter. The ChIP-seq-predicted binding site is represented by the arrow and spans from base −123 to base +58 relative to the TSS. MEME predicted two putative EBSs, S1 and S2, located at base −59 and base −10, respectively. Primers were designed to amplify regions −77 to +36 for ChIP analysis. (B) ChIP analysis of mtp53 and ETS2 association with this region in MDAH087 cells. ChIP was performed using antibodies against p53, ETS1, ETS2, and previously reported mtp53-binding partners as indicated. The qPCR data for the specific antibody immunoprecipitations are relative to nonspecific control IgG antibodies. Primers were designed to detect the predicted binding site and an offsite 2 kb stream of the binding site (mean ± SEM; [*] P-value ≤ 0.05 vs. IgG ChIP; [**] P-value ≤ 0.05 binding site vs. offsite). Western blot of TDP2 protein levels after different p53 and TDP2 siRNA knockdown in MDAH087 (C) and MIA PaCa-2 (D) cells. (E) Knockdown of wild-type (WT) p53 does not affect TDP2 protein levels. U2OS and WI-38 cells were transfected with either control (Ct) or p53 siRNA and then treated or untreated with doxorubicin (DX). A549 cells were transfected with control and p53 siRNA but were not treated with doxorubicin. The arrow indicates the TDP2 protein band. (F) Effect of mtp53 knockdown on TDP2 expression in various cell lines. A panel of breast and lung cancer cell lines was transfected with either control or p53 siRNA. MIA PaCa-2 cells transfected with TDP2 siRNA were included as a positive control for TDP2 detection (indicated by arrowhead). HCC1171 appears not to express TDP2. Knockdown of mtp53 and ETS2 reduces TDP2 protein levels in MDAH087 (G) and MIA PaCa-2 (H). The arrow indicates ETS1 protein in MIA PaCa-2 lysates. (I) Ectopic coexpression of mtp53 and ETS2 may increase TDP2 expression in p53-null Saos2 cells by stabilizing ETS2. Saos2 cells were transfected with plasmid DNA expressing myc-ETS2 with different p53 constructs. Cells were treated with 100 ng/mL cycloheximide (CHX) for the indicated time prior to harvesting for Western blot.
Figure 5.
Figure 5.
Functional analysis of TDP2 promoter. (A) mtp53 may coregulate the TDP2 promoter at S1. Wild-type (WT) TDP2 promoter or TDP2 promoter with point mutations in S1 or S2 converting the EBS sequence of GGAAG to AAAAA was cloned upstream of the luciferase ORF and cotransfected into MIA PaCa-2 cells with control (Ct), mtp53, ETS1, or ETS2 siRNA. Luciferase activity (relative response ratio) was normalized to Renilla luciferase levels (mean ± SEM; [*] P-value ≤ 0.01 vs. control siRNA of the same promoter). (B) Ectopic expression of mtp53 in p53-null Saos2 cells increases TDP2 promoter activity. Luciferase activity in Saos2 cells cotransfected with TDP2 promoter–luciferase plasmid and 50 ng of mtp53, mtp53 deletions, or p53 family member constructs (mean ± SEM; [*] P-value ≤ 0.05 vs. empty vector control). (C) Low levels of mtp53 R175H cooperate with ETS1 and ETS2 to activate cloned TDP2 promoter. Luciferase activity of Saos2 cells cotransfected with wild-type TDP2 promoter–luciferase plasmid or TDP2 promoter carrying mutations in S1, 10 ng of mtp53 R175H (a lower amount of p53 that does not show significant activation of TDP2 promoter), and titrating amounts of ETS1 or ETS2 DNA (mean ± SEM; [*] P-value ≤ 0.05 vs. control siRNA of the same promoter). (D) Titrating amounts of R248W mtp53 and ETS can also coactivate the TDP2 promoter. Luciferase assay was used to measure TDP2 promoter activity after cotransfection with titrating amounts of R248W mtp53 and ETS1 or ETS2 (mean ± SEM; [*] P-value ≤ 0.01 vs. vector/vector and ETS/vector). (E) ETS1, ETS2, and mtp53 can bind to biotinylated DNA in vitro. Double-stranded biotinylated DNA containing wild-type or S1 mutant site with an addition of 15 bp upstream of and downstream from the EBS was added to MIA PaCa-2 and U2OS nuclear extracts and pulled down with streptavidin beads. No biotinylated DNA was added for “mock” pull-down. (F) mtp53 requires ETS to bind to the TDP2 promoter in MIA PaCa-2 cells. ChIP was performed using MIA PaCa-2 cells transfected with control, p53, ETS1, or ETS2 siRNA. The data are from qPCR using ChIP DNA, with antibodies indicated relative to 1.0% input (mean ± SEM; [*] P-value ≤ 0.01 vs. IgG ChIP).
Figure 6.
Figure 6.
Reduction of TDP2 protein levels by depletion of either p53 or TDP2 sensitizes cells to etoposide. (A) MIA PaCa-2 cells were more sensitive to etoposide after TDP2 knockdown. MIA PaCa-2 cells were transfected with two different siRNAs targeting TDP2 and then treated with increasing concentrations of etoposide for 24 h. Cell viability was measured by CellTiter Blue assay (mean ± SD; [*] P-value ≤ 0.05 vs. control [Ct] siRNA of the same Eto concentration). (B) FACS analysis revealed increased apoptosis in TDP2 knockdown MIA PaCa-2 cells. MIA PaCa-2 cells were transfected with either control or TDP2 siRNA and, 2 d later, were treated with increasing concentrations of etoposide for 48 h. Cells were stained for cleaved caspase-3 and were assayed by flow cytometry. These are the representative data of three independent experiments. (C) Knockdown of mtp53 and TDP2 increases apoptosis when treated with etoposide. MIA PaCa-2 cells transfected with p53 or different TDP2 siRNAs were treated with increasing concentrations of etoposide for 24 h. Cells were analyzed by immunofluorescence microscopy to detect DAPI and cleaved caspase-3. Data represent caspase-3-positive cells normalized to untreated cells (mean ± SD; [*] P-value ≤ 0.05 vs. control siRNA of the same Eto concentration). (D) Western blot of MIA PaCa-2 cells transfected with different siRNAs and treated with 0, 10, 20, or 30 μg/mL etoposide for 48 h. Arrow represents cleaved PARP, which is an indicator of increased caspase activity and apoptosis. Intervening lanes are spliced out where indicated, but all siRNA and drug treatments represent data from the same immunoblot with the same exposure. (E) Ectopic expression of TDP2 rescues etoposide sensitivity in mtp53 and ETS2 knockdown MIA PaCa-2 cells. MIA PaCa-2 cells stably expressing TDP2 or empty vector were transfected with control, p53, or ETS2 siRNA. Cells were then treated with increasing concentrations of etoposide. Caspase-positive cells were assayed by flow cytometry. These data are representative of four independent experiments. (F) Western blot of untreated cells used in flow cytometric analysis confirmed that the ectopic expression of TDP2 is not affected by mtp53 or ETS2 knockdown.
Figure 7.
Figure 7.
Immunohistochemical staining of p53 and TDP2 in lung cancer or peri-cancer tissues. The representative staining images of a TMA stained with anti-EAPII and anti-p53 antibodies.

Similar articles

Cited by

References

    1. Adhikari S, Karmahapatra SK, Elias H, Dhopeshwarkar P, Scott Williams R, Byers S, Uren A, Roy R 2011. Development of a novel assay for human tyrosyl DNA phosphodiesterase 2. Anal Biochem 416: 112–116 - PMC - PubMed
    1. Adorno M, Cordenonsi M, Montagner M, Dupont S, Wong C, Hann B, Solari A, Bobisse S, Rondina MB, Guzzardo V, et al. 2009. A Mutant-p53/Smad complex opposes p63 to empower TGFβ-induced metastasis. Cell 137: 87–98 - PubMed
    1. Babayeva ND, Wilder PJ, Shiina M, Mino K, Desler M, Ogata K, Rizzino A, Tahirov TH 2010. Structural basis of Ets1 cooperative binding to palindromic sequences on stromelysin-1 promoter DNA. Cell Cycle 9: 3054–3062 - PMC - PubMed
    1. Bailey TL, Elkan C 1994. Fitting a mixture model by expectation maximization to discover motifs in biopolymers. Proc Int Conf Intell Syst Mol Biol 2: 28–36 - PubMed
    1. Basuyaux JP, Ferreira E, Stehelin D, Buttice G 1997. The Ets transcription factors interact with each other and with the c-Fos/c-Jun complex via distinct protein domains in a DNA-dependent and -independent manner. J Biol Chem 272: 26188–26195 - PubMed

Publication types

MeSH terms