. 2012 Jul;22(7):1282-94.
doi: 10.1101/gr.131920.111. Epub 2012 Apr 16.

Multidimensional regulation of gene expression in the C. elegans embryo

Affiliations

Multidimensional regulation of gene expression in the C. elegans embryo

John Isaac Murray et al. Genome Res. 2012 Jul.

Abstract

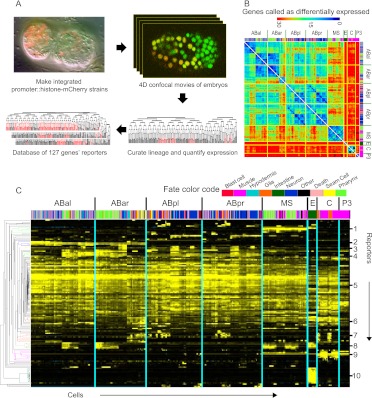
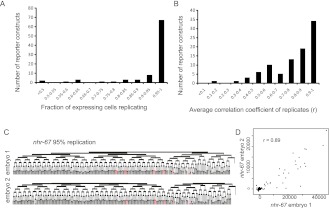
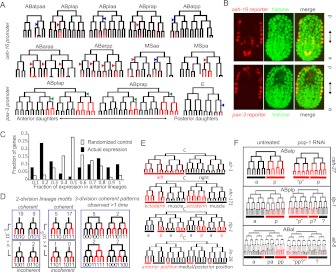
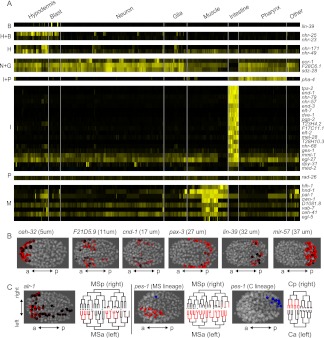
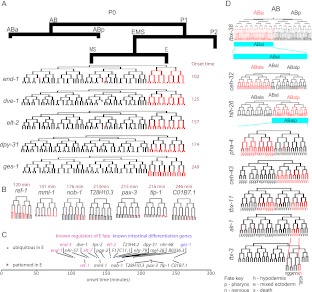
How cells adopt different expression patterns is a fundamental question of developmental biology. We quantitatively measured reporter expression of 127 genes, primarily transcription factors, in every cell and with high temporal resolution in C. elegans embryos. Embryonic cells are highly distinct in their gene expression; expression of the 127 genes studied here can distinguish nearly all pairs of cells, even between cells of the same tissue type. We observed recurrent lineage-regulated expression patterns for many genes in diverse contexts. These patterns are regulated in part by the TCF-LEF transcription factor POP-1. Other genes' reporters exhibited patterns correlated with tissue, position, and left-right asymmetry. Sequential patterns both within tissues and series of sublineages suggest regulatory pathways. Expression patterns often differ between embryonic and larval stages for the same genes, emphasizing the importance of profiling expression in different stages. This work greatly expands the number of genes in each of these categories and provides the first large-scale, digitally based, cellular resolution compendium of gene expression dynamics in live animals. The resulting data sets will be a useful resource for future research.


Figures

Figure 1.
Figure 1.
Reporters show expression in a wide range of patterns and onset times. (A) Data collection strategy. Confocal movies are collected and analyzed by cell tracking (StarryNite) to generate a cell lineage tree. Expression is visualized by converting the raw reporter intensity in each cell into a color on a black→red scale (from minimum to maximum expression) and displaying the color on the appropriate branch of the tree. (B) Heat map showing how many genes were expressed differently (10-fold criteria, see Methods) between each pair of leaf cells (arranged in lineage order with color-coded fate bar). The cells with the most closely related expression patterns are generally close lineal relatives (dark blue on diagonal axis). For example, a muscle cell (pink in fate color code) from the MS lineage is more similar in expression to all other MS-derived cells (including pharyngeal and nervous system cells; large diagonal lines) than it is to muscle cells from the C or P3 lineages (small diagonal lines). Tissue color code is shown below. Secondary diagonals of similar cells (e.g., between ABpl and ABpr) represent l-r symmetric lineages; these symmetries were also observed by Liu et al. (2009) in 363 larval cells. (C) Expression patterns organized by hierarchical clustering (y-axis). The cells (x-axis) are arranged in lineage order. The numbered clusters (right), which correspond to the colored sections of the tree on the left, include multiple constructs with patterns biased toward (1) EMS lineage, (2) ABa lineage, (3) AB sublineages, (4) AB notch-signaled lineages (Priess 2005), (5) broad or ubiquitous patterns, (6) broad expression with hypodermal bias, (7) hypodermal precursors, (8) pharyngeal and intestinal precursors, (9) muscle precursors, (10) intestinal precursors. A full-resolution version of the cluster view is available as Supplemental Figure 3.
Figure 2.
Figure 2.
Consistency of observed expression in replicates. (A) Replication frequency for each reporter construct. For each pair of replicate embryos, we calculated the fraction of cells expressing with a peak intensity >5000 in the first embryo that also expressed with a peak intensity >2000 in the second embryo, and display the results after averaging for each gene (n = 52 genes). (B) Quantitative consistency. We compared the average fluorescence intensities of all cells for each by calculating the correlation coefficient (r), and averaged the correlation coefficients obtained for all replicates of a given gene. (C) An example pair of replicates for nhr-67, a case where the replication frequency is 95% and (D) the correlation coefficient is 0.89. This approximately represents the lower quartile of replication (75% of genes were more consistent in their expression than this pair).
Figure 3.
Figure 3.
Lineage motifs and reuse of anterior-posterior expression logic. (A) ceh-16 and pax-3 reporters are expressed in multiple sublineages. The diagrams are organized according to the conventions of Sulston et al. (1983), with time on the vertical axis, divisions represented by horizontal lines, and the anterior daughter placed in the left position of each division. Red intensity is displayed proportional to the measured fluorescence signal. Arrowheads mark inferred commitment points (Color of arrowheads: [red] identified using the fivefold difference in lineage average criterion used for Supplemental Table 5 and described in detail in the methods; [blue] lineages below the fivefold cutoff identified by manual inspection, actual fold difference for these cases was between threefold and fivefold). In one of three pax-3 replicates, additional weak expression below our threshold was observed in the (posterior-derived) ABarp lineage, and the ceh-16 reporter was expressed at low levels (also well below the threshold) in the additional posterior-derived lineage ABprappp. (B) Three dimensional projections of confocal micrographs show the terminal positions of expressing cells for the reporters shown in A are distributed over the full length of the embryo. (C) Histogram showing that reporters differentially expressed in three or more lineages (black bars, using the fivefold lineage-based cutoff) are biased toward mostly anterior or mostly posterior lineages relative to randomized control (white bars). (D) Identification of lineage motifs. (Left) Example showing mapping of egl-5 reporter expression (top) onto a binary two-division pattern (bottom). (Right) Frequency of 2-division and 3-division lineage patterns. (E) Examples of A–P patterns in the lineage derived from the C founder cell. In some cases lineage patterns are correlated with tissue identity (nhr-171) or position (lin-39). (F) Changes in reporter expression after pop-1 RNAi. tlp-1 and ceh-27 show ectopic expression in the anterior lineage (a→p conversion), tlp-1 and elt-6 show both gain of anterior expression and loss of posterior expression.
Figure 4.
Figure 4.
Multidimensional regulation of expression. (A) Tissue-correlated expression. Cells are arranged by tissue on the x-axis and genes are sorted by which tissue or combination of tissues they are best correlated with: (B) Blast; (H) Hypodermis; (N) Neuron; (G) Glia; (I) Intestine; (P) Pharynx; (M) Muscle. Genes were included if their correlation coefficient to a given tissue identity was greater than 0.4. (B) Position-correlated expression. Three dimensional models showing the location and measured intensity of all expressing cells for six reporters expressed in specific anterior–posterior positions at the 350-cell stage. (C) Left–right asymmetric expression (expression in an individual cell pair considered asymmetric if at least 10-fold different, see Methods for details). For the alr-1 reporter, all expressing cells are shown in the projection colored by intensity, and the lineage shows left-biased expression in the MSa and MSp lineages. MSa (left) and MSp (right) produce symmetrically equivalent cells except for the branches marked with an asterisk (*). pes-1 reporter expression in MS is biased for the left (MSa colored red) cells and only expressed in one right (MSp colored blue) cell, while in the C lineage the expression is limited to right cells (Cp, colored blue). Notably, pes-1 expression in other lineages is L–R symmetric.
Figure 5.
Figure 5.
Lineage-specific cascades suggest regulatory pathways. (A) Expression of a subset of E-lineage-specific patterns arranged by onset time (E-specific expression identified using the fivefold lineage cutoff). (B) Reporters with patterned expression in the E lineage. (C) Timing of all E-specific patterns. (D) Lineage-aligned reporter expression patterns of eight genes showing progressive restriction of expression in the daughters of AB (tbx-38), ABal (ceh-32 and hlh-26), ABalp (pha-4 and ceh-43) and ABalp daughters (tbx-11), granddaughter (alr-1), and in the left ASK neuron derived from this lineage (ttx-3). A poster-sized curated set of patterns distinguishing cells of all lineages is available as a Supplemental Poster.

References

    1. Ahringer J 1996. Posterior patterning by the Caenorhabditis elegans even-skipped homolog vab-7. Genes Dev 10: 1120–1130 - PubMed
    1. Allen MA, Hillier LW, Waterston RH, Blumenthal T 2011. A global analysis of C. elegans trans-splicing. Genome Res 21: 255–264 - PMC - PubMed
    1. Bao Z, Murray JI, Boyle T, Ooi SL, Sandel MJ, Waterston RH 2006. Automated cell lineage tracing in Caenorhabditis elegans. Proc Natl Acad Sci 103: 2707–2712 - PMC - PubMed
    1. Baugh LR, Hill AA, Claggett JM, Hill-Harfe K, Wen JC, Slonim DK, Brown EL, Hunter CP 2005. The homeodomain protein PAL-1 specifies a lineage-specific regulatory network in the C. elegans embryo. Development 132: 1843–1854 - PubMed
    1. Baumeister R, Liu Y, Ruvkun G 1996. Lineage-specific regulators couple cell lineage asymmetry to the transcription of the Caenorhabditis elegans POU gene unc-86 during neurogenesis. Genes Dev 10: 1395–1410 - PubMed

Publication types

MeSH terms

Substances

LinkOut - more resources