. 2012 Jul;32(13):2416-27.
doi: 10.1128/MCB.06771-11. Epub 2012 Apr 16.

Cks1 promotion of S phase entry and proliferation is independent of p27Kip1 suppression

Affiliations

Cks1 promotion of S phase entry and proliferation is independent of p27Kip1 suppression

Alexander Hoellein et al. Mol Cell Biol. 2012 Jul.

Abstract

Cks1 is an activator of the SCF(Skp2) ubiquitin ligase complex that targets the cell cycle inhibitor p27(Kip1) for degradation. The loss of Cks1 results in p27(Kip1) accumulation and decreased proliferation and inhibits tumorigenesis. We identify here a function of Cks1 in mammalian cell cycle regulation that is independent of p27(Kip1). Specifically, Cks1(-/-); p27(Kip1-/-) mouse embryonic fibroblasts retain defects in the G(1)-S phase transition that are coupled with decreased Cdk2-associated kinase activity and defects in proliferation that are associated with Cks1 loss. Furthermore, concomitant loss of Cks1 does not rescue the tumor suppressor function of p27(Kip1) that is manifest in various organs of p27(Kip1-/-) mice. In contrast, defects in mitotic entry and premature senescence manifest in Cks1(-/-) cells are p27(Kip1) dependent. Collectively, these findings establish p27(Kip1)-independent functions of Cks1 in regulating the G(1)-S transition.


Figures

Fig 1
Fig 1
The effects of Cks1 loss differ from ectopic p27Kip1 expression. (A) The percentage of primary asynchronously growing MEFs of the indicated genotype in the G1, S, and G2/M phases was assessed by flow cytometry (BrdU incorporation, 7-AAD staining). Bars represent the mean of three independent experiments ± the standard error of the mean (SEM). (B) Immunoblot analysis of MEFs of the indicated Cks1 genotype for p27Kip1 expression with or without 5 h of incubation with proteasome inhibitor MG132. (C) Ectopic expression of p27Kip1 and the mutant T187A-p27Kip1 (T187) in Cks1+/+ and Cks1−/− MEFs as assessed by immunoblotting. (D) Cell cycle assessed by BrdU incorporation. A representative histogram of three independently performed experiments is shown.
Fig 2
Fig 2
Partial rescue of the p27Kip1-null size phenotype by concomitant Cks1 loss. (A) Rates for mice of the indicated genotypes born alive compared to the expected Mendelian distribution. (B) Representative p27Kip1−/−, wild-type, p27Kip1−/−; Cks1−/−, and Cks1−/− mice depicting size differences. (C) Development of body weight in p27Kip1−/−; Cks1+/+ (blue line), wild-type (p27Kip1+/+; Cks1+/+, black line), p27Kip1−/−; Cks1−/− (red line) and p27Kip1+/+; Cks1−/− (green line) mice. Each time point indicates the mean body weight ± the SEM assessed in 4 male mice of each genotype. (D) Mean maximum diameter ± the SEM of the spleen and thymus from 10- to 12-week-old mice of the indicated genotype (n = 6 each). Asterisks indicate significant differences.
Fig 3
Fig 3
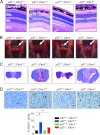
Cks1 is dispensable for p27Kip1 tumor suppressor function. (A) Representative histological sections of hematoxylin-and-eosin (HE)-stained retinae derived from 10- to 12-week-old mice of the indicated genotypes. Arrows display disorganization of nuclear layers. ONL, outer nuclear layer; INL, inner nuclear layer; GCL, ganglion cell layer. The mean number of cells per infiltrate was 25 in p27Kip1−/− retinae versus 5 cells per infiltrate in p27Kip1−/−; Cks1−/− retinae. (B) Representative photographs of pituitary glands from 1-year-old mice show enlargement upon loss of p27Kip1. (C) HE staining of representative histological sections from pituitary glands of 1-year-old mice showing hyperplastic nodules in p27Kip1−/−; Cks1+/+ mice and p27Kip1−/−; Cks1−/− mice. (D) Ki67 staining of the Pars intermedia of the pituitary gland shows increased proliferative activity upon p27Kip1 loss independent of the Cks1 status. The lower panel shows the quantification of Ki67 positivity in the pituitary glands of mice of the indicated genotype. The differences between wt and p27Kip1−/− mice, and as well as p27Kip1−/−; Cks1−/− mice, are statistically significant. *, P < 0.05.
Fig 4
Fig 4
Cks1 prevents p27Kip1 accumulation at G2-M but regulates G1-S independent of p27Kip1. (A) Cks1−/− MEFs show defective proliferation irrespective of p27Kip1 status. A growth curve of primary early-passage MEFs was determined. The cells were counted by trypan blue exclusion at the indicated times. Shown is the mean cell number ± the SEM (n = 4 for each genotype). (B) Cell cycle assessment of asynchronously growing MEFs of the indicated genotypes by flow cytometry. Shown are the results of a representative analysis of BrdU incorporation and DNA content. (C) Quantification of cells in each phase of the cell cycle (mean ± the SEM; n = 2 for each genotype). Asterisks indicate significant differences at P < 0.05. (D) MEFs of the indicated genotype were cultivated in 3% atmospheric oxygen. The results of a cell cycle assessment of asynchronously growing MEFs by flow cytometry are shown. (E) Quantification of cells in each phase of the cell cycle (mean ± the SEM; n = 3 each genotype) that were grown as described in panel D. *, P < 0.05. (F and G) Immunoblotting (F) and flow cytometry (G) upon reexpression of Cks1 show rescued proliferation assessed by BrdU incorporation.
Fig 5
Fig 5
Acute loss of Cks1 leads to defective growth in primary MEFs and in immortalized fibroblasts. (A) Acute Cks1 depletion with two different shRNA constructs in Cks1+/+; p27+/+ MEFs. Immunoblotting is shown in the left panel; quantification of the BrdU-positive cell fraction is shown in the right panel (n = 4 independent experiments; bars represent the mean ± the SEM). Single asterisks indicate significant differences at P < 0.05; **, P < 0.01. (B) Cks1 knockdown in p27−/− MEFs. Immunoblotting is shown in the left panel; quantification of the BrdU-positive cell fraction is shown in the right panel (n = 4 independent experiments). (C) NIH 3T3 murine fibroblasts were infected with shRNA for Cks1. Shown is the protein expression (left panel) and the fraction of BrdU-positive cells (right panel) for three independent experiments; *, P < 0.01). (D) p27−/− MEFs were immortalized according to the 3T3 protocol, and passage 50 cells were infected with shRNA for Cks1. Shown is the protein expression (left panel) and the quantification of BrdU-positive immortal p27−/− passage 50 fibroblasts (right panel, n = 2).
Fig 6
Fig 6
Senescence in Cks1−/− MEFs is caused by p27Kip1 accumulation. (A) β-Galactosidase staining of passage 6 MEFs. Various senescent cells are labeled by arrows. Representative pictures are shown. (B) Quantification of senescent cells. Bars indicate the mean ± the SEM from three independent experiments. ***, P < 0.001.
Fig 7
Fig 7
Loss of Cks1 reduces the fraction of cells entering the S phase of the cell cycle. NIH 3T3 cells were infected with virus bearing shRNA constructs directed against Cks1 (shCks1) or empty plasmid (control). (A) The cells were then released from a G1/S block (serum starvation and aphidicholin treatment). Analysis of DNA content at the indicated time points following the release was performed. Shown are the results of a representative experiment. (B) Percentage of cells in the G1, S, or G2/M phase at the indicated time points. Shown are the results (mean ± the SEM) from n = three independent experiments. *, P < 0.05. (C) Immunoblot analysis of the indicated proteins at each given time point. (D) The cells described above were released from a double thymidine block. BrdU uptake was detected by flow cytometry at the indicated time points. Shown is the quantification of two independently performed experiments.
Fig 8
Fig 8
Cks1 promotes cell proliferation independent of p21Cip1, p27Kip1, p57Kip2, and p130. (A) Protein expression of p21Cip1, p27Kip1, p57Kip2, and p130 in asynchronously growing MEFs of the indicated genotypes assessed by immunoblotting. (B) Combined shRNA-mediated knockdown (p130 and Cks1) in NIH 3T3 cells. Immunoblot analysis for protein expression (left panel) was carried out. The percentage of BrdU-positive cells was determined (right panel, n = 3 independent experiments; *, P < 0.05). (C) shRNA-mediated knockdown of the indicated genes in early-passage p27Kip1+/+ and p27Kip1 −/− MEFs. Immunoblot analysis for protein expression (left panel) was performed. The percentages of BrdU-positive cells (right panel, n = 2 independent experiments; **, P < 0.01) were determined. (D) Cks1 shRNA knockdown in early-passage p21−/− and p21−/−; p27−/− MEFs. Protein expression (left panel) and BrdU flow cytometry analysis (right panel) were performed.
Fig 9
Fig 9
Cks1 effects on transcript and protein levels of cell cycle regulators unmasked in p27-null cells. (A) Real-time PCR analysis of transcript levels in asynchronously growing MEFs. Shown is the mean relative expression ± the SEM. Values are normalized to the expression of ubiquitin (ub), with the wt control set as 1. At least three embryos per genotype were used to generate MEFs and analyzed separately. (B) Immunoblot analysis of the indicated proteins from asynchronously growing MEFs. Protein expression of two different embryos of each genotype is shown. (C) Kinase activities of Cdk1, Cdk2, cyclin A, and cyclin E complexes. Immunoprecipitates from asynchronously growing MEFs were assessed for their histone H1 phosphorylation activity. Shown are the results of one representative experiment. (D) Quantification of kinase activity. Shown are the means ± the SEM of three independently performed experiments. Asterisks indicate P < 0.05. (E) The inhibitory phosphorylation of Cdk1 and Cdk2 at thyrosin 15 (P-Y15-Cdk1 and P-Y15-Cdk2) was assessed by immunoblotting with specific antibodies. (F) Assessment of Cdk1 and Cdk2 protein level, inhibitory phosphorylation, and kinase activity in immortal NIH 3T3 cells following shCks1 knockdown.

References

    1. Aleem E, Kiyokawa H, Kaldis P. 2005. Cdc2-cyclin E complexes regulate the G1/S phase transition. Nat. Cell Biol. 7: 831–836 - PubMed
    1. Arvai AS, Bourne Y, Hickey MJ, Tainer JA. 1995. Crystal structure of the human cell cycle protein CksHs1: single domain fold with similarity to kinase N-lobe domain. J. Mol. Biol. 249: 835–842 - PubMed
    1. Bassermann F, et al. 2008. The Cdc14B-Cdh1-Plk1 axis controls the G2 DNA-damage-response checkpoint. Cell 134: 256–267 - PMC - PubMed
    1. Berthet C, Aleem E, Coppola V, Tessarollo L, Kaldis P. 2003. Cdk2 knockout mice are viable. Curr. Biol. 13: 1775–1785 - PubMed
    1. Bhattacharya S, et al. 2003. SKP2 associates with p130 and accelerates p130 ubiquitylation and degradation in human cells. Oncogene 22: 2443–2451 - PubMed

Publication types

MeSH terms

Substances

LinkOut - more resources