. 2012 May 1;109(18):7079-84.
doi: 10.1073/pnas.1120174109. Epub 2012 Apr 16.

Snapshot of virus evolution in hypersaline environments from the characterization of a membrane-containing Salisaeta icosahedral phage 1

Affiliations

Snapshot of virus evolution in hypersaline environments from the characterization of a membrane-containing Salisaeta icosahedral phage 1

Antti P Aalto et al. Proc Natl Acad Sci U S A. .

Abstract

The multitude of archaea and bacteria inhabiting extreme environments has only become evident during the last decades. As viruses apply a significant evolutionary force to their hosts, there is an inherent value in learning about viruses infecting these extremophiles. In this study, we have focused on one such unique virus-host pair isolated from a hypersaline environment: an icosahedral, membrane-containing double-stranded DNA virus--Salisaeta icosahedral phage 1 (SSIP-1) and its halophilic host bacterium Salisaeta sp. SP9-1 closely related to Salisaeta longa. The architectural principles, virion composition, and the proposed functions associated with some of the ORFs of the virus are surprisingly similar to those found in viruses belonging to the PRD1-adenovirus lineage. The virion structure, determined by electron cryomicroscopy, reveals that the bulk of the outer protein capsid is composed of upright standing pseudohexameric capsomers organized on a T = 49 icosahedral lattice. Our results give a comprehensive description of a halophilic virus-host system and shed light on the relatedness of viruses based on their virion architecture.


Conflict of interest statement

The authors declare no conflict of interest.

Figures
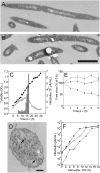
Fig. 1.
Fig. 1.
SSIP-1 is a lytic bacteriophage infecting Salisaeta sp. SP9-1. (A and B) Thin-section electron microscopic image of (A) SP9-1 and (B) Salisaeta longa. White areas are holes caused by the high salt concentration. (Scale bar in B, 1 μm for A and B.) (C) SSIP-1 life cycle. Optical density of SSIP-1 infected [using a multiplicity of infection (MOI) of 10; open circles] and uninfected (closed circles) SP9-1 cultures was observed for 30 h. At 6 h to 17 h postinfection (p.i.) samples were collected, the bacteria pelleted by centrifugation, and the supernatants assayed for infective viruses (gray bars). (D) Thin-section electron microscopic images of SSIP-1 infected SP9-1 cell at 17 h p.i. containing virus particles (arrows). (Scale bar, 200 nm.) (E) Binding of SSIP-1 on SP9-1 (closed circles) and S. longa (open circles). For control, no cells were added (triangles). After the removal of bound viruses and cells, the supernatants were assayed for infective free viruses (n = 3). Error bars indicate SEM. (F) SSIP-1 was incubated at the indicated salt water (SW, % wt/vol) buffers for 3 h (closed circles), 1 d (open circles), and 7 d (triangles), and the infectivity was assayed.
Fig. 2.
Fig. 2.
The genome of SSIP-1 is a circular dsDNA molecule with 57 predicted ORFs. Inner graph indicates the GC profile of the genome. Predicted ORFs and genes (1–57) are seen on the outer circle. ORFs in the forward and reverse directions are colored in blue and green, respectively. Gene products that have been confirmed to be structural proteins of the virion are marked in red (Fig. 3C and Table S7). Unique restriction enzyme cleavage sites are indicated in the outermost circle. Tandem repeat sequences were located in ORF 27 (3.5× GAGTGGAACACCCGCGGAACAGT, 4.6× GGAACAGTCGT), ORF 29 (2.2× CTCCGCCAGCAGAAGAAAGAG), and ORF 52 (2.4× CGGTGGTGGCGGCGGTAATCCCGGCGGTGGCTA). (Numbers before the tandem repeat sequences indicate how many times the corresponding sequence is repeated.) Red lollipops indicate predicted terminator sequences and putative σ70-promoter regions are shown by gray arrows.
Fig. 3.
Fig. 3.
Lipids and structural proteins of SSIP-1. (A) SSIP-1 purified to near homogeneity. Graph indicates absorbance (open circles), density (closed circles), and infectivity (bars) of the CsCl gradient equilibrium centrifugation fractions from the final purification step. Only the virus band-containing fractions are shown. (B) Extracted polar lipids of SSIP-1, Salisaeta sp. SP9-1, Salisaeta longa and Salinibacter ruber were analyzed by TLC followed by iodine vapor staining. Major lipid bands that differ quantitatively between SP9-1 and SSIP-1 are indicated by arrows. (C) SSIP-1 was analyzed by SDS-PAGE. “M” is a molecular marker (Fermentas; SM0661). Major protein bands that were subjected to N-terminal protein sequences are indicated by an asterisk and the ones subjected to mass spectrometry are indicated by a hashmark. Major capsid proteins (MCPs) are indicated by arrows. Gene products (gp) determined by proteomics are given (Table S7 and Fig. 2).
Fig. 4.
Fig. 4.
Icosahedral reconstruction of the SSIP-1 virion. (A) Electron micrograph of SSIP-1 virions vitrified at 9% (wt/vol) salt water (SW) buffer (see composition in Table S2). Three spikes are indicated with black arrowheads (Scale bar, 50 nm.) (B) Central slice through an icosahedral reconstruction. Inset shows a radially averaged density profile. DNA (D), membrane (M), capsid (C), and spikes (S) are indicated. Twofold, threefold, and fivefold axes of icosahedral symmetry are indicated by an ellipse, a triangle, and a pentagon, respectively. Three concentric layers of DNA are indicated with asterisks. Lipid bilayer is interrupted by transmembrane densities at the threefold axes of symmetry (triangle). (C) Radially colored isosurface representation of the reconstruction with an arbitrary handedness is rendered at 2σ above the mean density. Color bar shows radial coloring. Inset shows a model lattice exemplifying the T = 49 icosahedral triangulation. Geometrical arrangement of the capsomers is given by the relationship T = h2 + hk + k2, where h and k define the lattice point. Here h = 7, k = 0. The two frontmost fivefold vertices are in red. (DF) Six times magnified close-ups of the reconstruction taken along the (D) twofold, (E) threefold, and (F) fivefold axes of symmetry.

References

    1. Bamford DH. Do viruses form lineages across different domains of life? Res Microbiol. 2003;154:231–236. - PubMed
    1. Jalasvuori M, Bamford JK. Structural co-evolution of viruses and cells in the primordial world. Orig Life Evol Biosph. 2008;38:165–181. - PubMed
    1. Forterre P, Prangishvili D. The origin of viruses. Res Microbiol. 2009;160:466–472. - PubMed
    1. Holmes EC. What does virus evolution tell us about virus origins? J Virol. 2011;85:5247–5251. - PMC - PubMed
    1. Oren A. Microbial life at high salt concentrations: Phylogenetic and metabolic diversity. Saline Syst. 2008;4:2. - PMC - PubMed

Publication types

Associated data