. 2012 May 1;109(18):6975-80.
doi: 10.1073/pnas.1120043109. Epub 2012 Apr 16.

Lysocardiolipin acyltransferase 1 (ALCAT1) controls mitochondrial DNA fidelity and biogenesis through modulation of MFN2 expression

Affiliations

Lysocardiolipin acyltransferase 1 (ALCAT1) controls mitochondrial DNA fidelity and biogenesis through modulation of MFN2 expression

Jia Li et al. Proc Natl Acad Sci U S A. .

Abstract

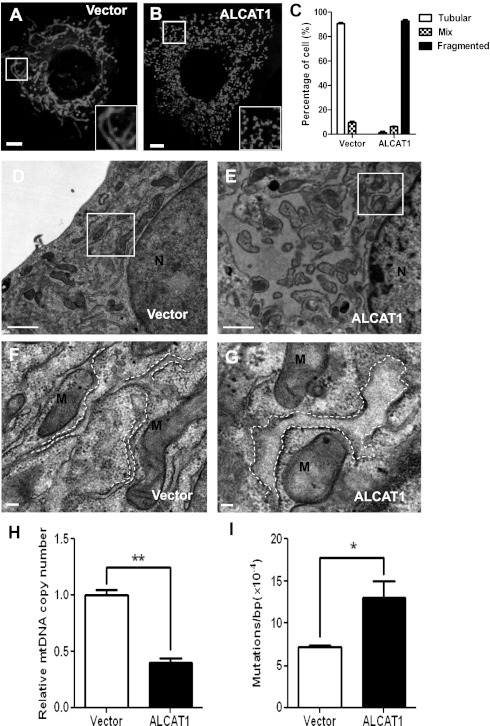
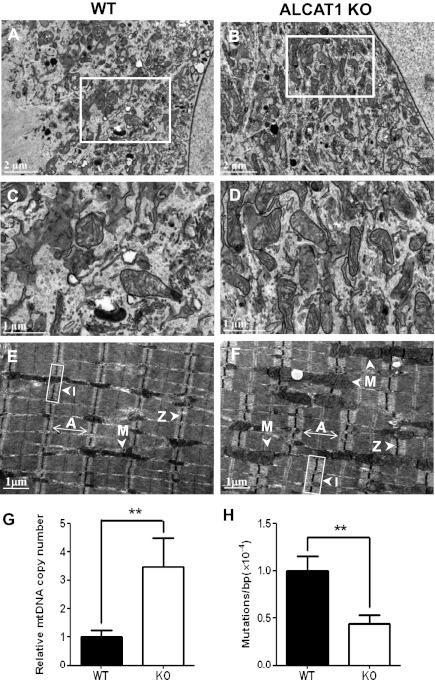
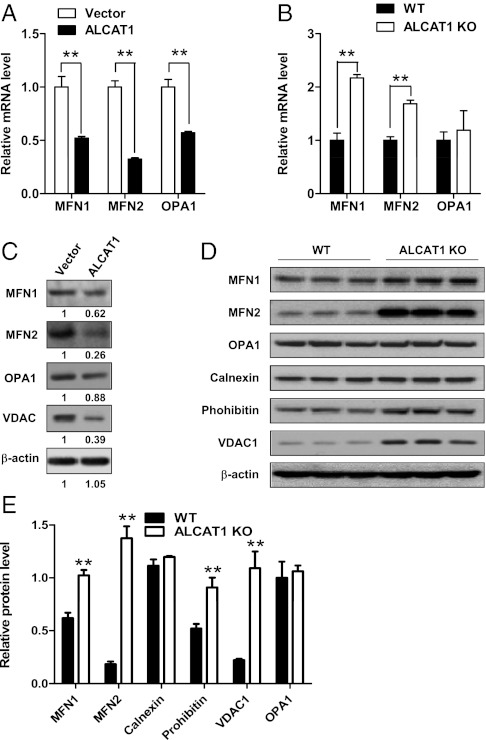
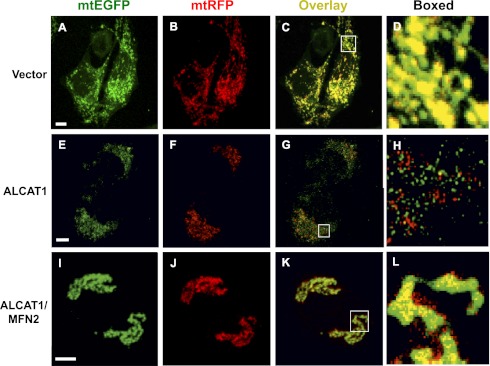
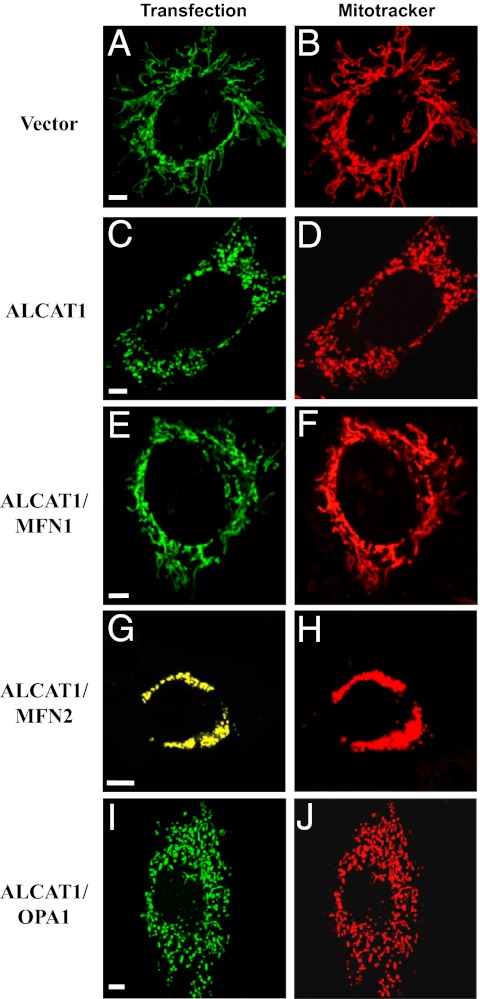
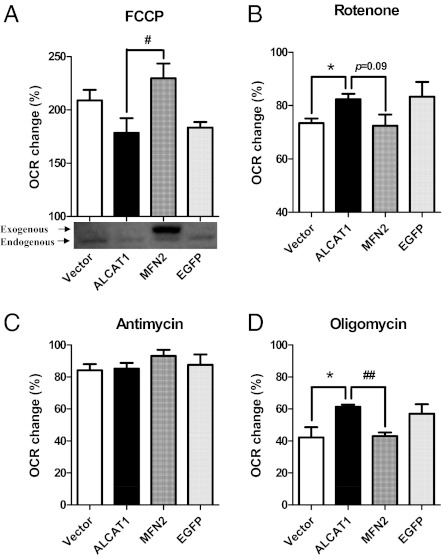
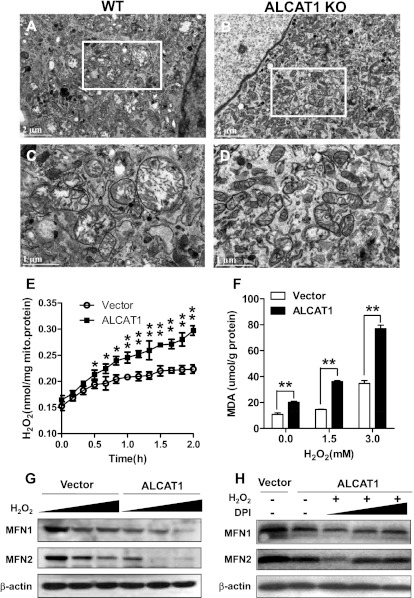
Oxidative stress causes mitochondrial fragmentation and dysfunction in age-related diseases through unknown mechanisms. Cardiolipin (CL) is a phospholipid required for mitochondrial oxidative phosphorylation. The function of CL is determined by its acyl composition, which is significantly altered by the onset of age-related diseases. Here, we examine a role of acyl-CoA:lysocardiolipin acyltransferase lysocardiolipin acyltransferase 1 (ALCAT1), a lysocardiolipin acyltransferase that catalyzes pathological CL remodeling, in mitochondrial biogenesis. We show that overexpression of ALCAT1 causes mitochondrial fragmentation through oxidative stress and depletion of mitofusin mitofusin 2 (MFN2) expression. Strikingly, ALCAT1 overexpression also leads to mtDNA instability and depletion that are reminiscent of MFN2 deficiency. Accordingly, expression of MFN2 completely rescues mitochondrial fusion defect and respiratory dysfunction. Furthermore, ablation of ALCAT1 prevents mitochondrial fragmentation from oxidative stress by up-regulating MFN2 expression, mtDNA copy number, and mtDNA fidelity. Together, these findings reveal an unexpected role of CL remodeling in mitochondrial biogenesis, linking oxidative stress by ALCAT1 to mitochondrial fusion defect.


Conflict of interest statement

The authors declare no conflict of interest.

Figures

Fig. 1.
Fig. 1.
ALCAT1 causes mitochondrial fragmentation and mtDNA instability in C2C12 cells. (A and B) Confocal microscopic analysis of mitochondrial network in C2C12 cells stably expressing ALCAT1 (B) or vector control (A) stained with MitoTracker Red. Insets represent magnification of the boxed areas. (Scale bars: 5 μm.) (C) Quantitative analysis of mitochondrial morphology in C2C12 cells expressing ALCAT1 or vector control in three categories: tubular, mix, and fragmented from three independent experiments (n = 300). (D–G) EM analysis of mitochondrial morphology in C2C12 cells stably expressing vector control (D; enlarged in F) or ALCAT1 (E; enlarged in G). ER morphology is highlighted by dashed lines. (Scale bars: 1 μm.) (H and I) RT-PCR analysis of mtDNA copy number (H) and point mutation rate (I) in C2C12 cells stably expressing ALCAT1 or vector control. *P < 0.05; **P < 0.01 (n = 3). N, nucleus; M, mitochondria.
Fig. 2.
Fig. 2.
ALCAT1 deficiency significantly increases mitochondrial mass and improves mtDNA fidelity. (AD) EM analysis of mitochondrial morphology of MEF cells isolated from wild-type (WT) control mice (A; enlarged in C) and from ALCAT1 KO mice (B; enlarged in D). (E and F) EM analysis of the tibialis anterior longitudinal section from WT mice (E) and ALCAT1 KO mice (F). Arrows indicate A band, I bands, Z line, and mitochondria (M), respectively. (G and H) RT-PCR analysis of mtDNA copy number (G) and point mutation rate (H) in MEF cells isolated from KO mice and the WT controls. **P < 0.01 (n = 3).
Fig. 3.
Fig. 3.
ALCAT1 regulates biogenesis of MFN1 and MFN2. (A and B) Real-time PCR analysis of mRNA expression levels of MFN1, MFN2, and OPA1 in C2C12 cells stably expressing ALCAT1 or vector control (A) and in MEFs isolated from WT and KO mice (B). GAPDH expression was used as an internal control. (C) Western blot analysis of MFN1, MFN2, OPA1, and VDAC1 protein levels in C2C12 cells expressing ALCAT1 or vector control. Relative density of each band was shown under each lane. (D) Western blot analysis of protein levels of MFN1, MFN2, OPA1, calnexin, prohibitin, and VDAC1 in MEFs isolated from KO and WT control mice (n = 3 fetuses in each group). (E) Quantitative analysis of data shown in E after normalization with the expression level of OPA1. **P < 0.01 compared with vector control or WT control mice.
Fig. 4.
Fig. 4.
ALCAT1 impairs mitochondrial fusion, which can be rescued by MFN2 expression in C2C12 cells. C2C12 cells stably expressing ALCAT1 or vector control were transiently transfected with expression plasmid for mitochondrial-targeted GFP or DsRed (mtRFP), coplated, and fused with PEG-1500, followed by confocal microscopic imaging. (AD) Confocal images of mitochondria in C2C12 cells stably expressing vector control, which demonstrated complete fusion, as evidenced by the yellow color in panel C and highlighted in D. (EH) Images of mitochondria in C2C12 cell stably expressing ALCAT1, which exhibited a fusion defect, as shown by the separated green and red colors in G and highlighted in H. (IL) Transient expression of MFN2 (MFN2-YFP) rescued the fusion defect in C2C12 cells stably expressing ALCAT1 (K; highlighted in L). (Scale bar: 5 μm.)
Fig. 5.
Fig. 5.
Overexpression of MFN1 and MFN2, but not OPA1, restores mitochondrial network in C2C12-A1 cells. (AD) Confocal image analysis of mitochondrial network in C2C12 cells stably expressing vector control (A and B) or ALCAT1 (C and D). The stable C2C12 cell lines were transiently transfected with mitochondrial-targeted EGFP expression vector (A and C) and stained with MitoTracker Red (B and D) before imaging. (EJ) Confocal image analysis of mitochondrial network in C2C12 cells stably expressing ALCAT1 and transiently transfected with expression vectors for Myc-tagged MFN1 (E and F), MFN2-YFP (yellow fluorescence protein) (G and H), or Myc-tagged OPA1 (I and J), respectively. For the Myc-tagged proteins, cells were first stained with MitoTracker Red and then fixed, followed sequentially by immunostaining with mouse anti-Myc antibodies and goat anti-mouse FITC-conjugated secondary antibodies (green). (Scale bar: 5 μm.)
Fig. 6.
Fig. 6.
MFN2 restores the mitochondrial respiratory capacity in C2C12 cells stably expressing ALCAT1. C2C12 cells stably expressing ALCAT1 were transiently transfected with expression vectors for MFN2 or EGFP and were compared with vector control for changes in OCR in response to treatment with various mitochondrial inhibitors, including: FCCP, an mitochondrial uncoupler (A); rotenone, a complex I inhibitor (B); antimycin, a complex III inhibitor (C); and oligomycin, an ATPase inhibitor (D). The exogenous and endogenous MFN2 protein levels were analyzed by Western blot analysis using MFN2 antibodies, as shown in A. OCR was analyzed by Seahorse X-24 analyzer and calculated from at least three independent measurements for each chemical treatment. *P < 0.05 compared with control; #P < 0.05 and ##P < 0.01 compared with nontransfected ALCAT1-expressing cells.
Fig. 7.
Fig. 7.
Oxidative stress by ALCAT1 links ROS production to MFN2 deficiency. (AD) EM analysis of mitochondrial morphology in MEF from WT mice (A; highlighted in C) or KO mice (B; highlighted in D) treated with 1 mM H2O2. (E) Real-time production of H2O2 from isolated mitochondria from C2C12 cells overexpressing vector or ALCAT1. (F) C2C12 cells were treated with indicated doses of H2O2 for 1 h, followed by analysis for the level of MDA, a lipid peroxidation product from oxidative stress. (G) C2C12 cells stably expressing vector control or ALCAT1 were treated with increasing doses of H2O2 for 1 h as indicated in F, followed by Western blot analysis for MFN1 and MFN2 expression. (H) Western blot analysis of MFN1 and MFN2 expression in C2C12 cells stably expressing vector, ALCAT1, or ALCAT1 but were pretreated for 1 h with increasing doses (0, 1, and 5 μM) of DPI, an NADPH oxidase inhibitor, followed by treatment with 1.5 mM H2O2 for 1 h. *P < 0.05; **P < 0.01 compared with vector control.

References

    1. Haigis MC, Yankner BA. The aging stress response. Mol Cell. 2010;40:333–344. - PMC - PubMed
    1. Li J, et al. Cardiolipin remodeling by ALCAT1 links oxidative stress and mitochondrial dysfunction to obesity. Cell Metab. 2010;12:154–165. - PMC - PubMed
    1. Chan DC. Mitochondria: Dynamic organelles in disease, aging, and development. Cell. 2006;125:1241–1252. - PubMed
    1. Edwards JL, et al. Diabetes regulates mitochondrial biogenesis and fission in mouse neurons. Diabetologia. 2010;53:160–169. - PMC - PubMed
    1. Bayir H, et al. Selective early cardiolipin peroxidation after traumatic brain injury: An oxidative lipidomics analysis. Ann Neurol. 2007;62:154–169. - PubMed

Publication types

MeSH terms

LinkOut - more resources