. 2012 May 1;109(18):7019-24.
doi: 10.1073/pnas.1120181109. Epub 2012 Apr 16.

Membrane binding of Escherichia coli RNase E catalytic domain stabilizes protein structure and increases RNA substrate affinity

Affiliations

Membrane binding of Escherichia coli RNase E catalytic domain stabilizes protein structure and increases RNA substrate affinity

Oleg N Murashko et al. Proc Natl Acad Sci U S A. .

Abstract

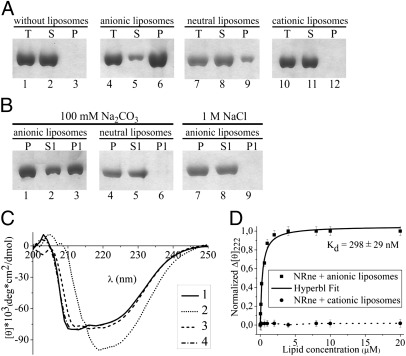
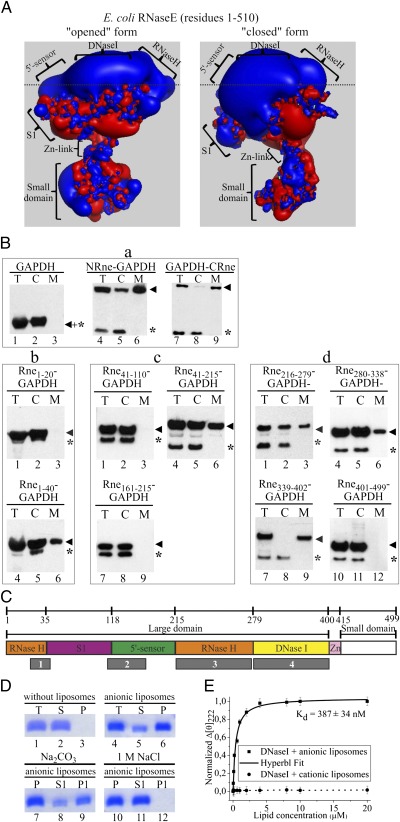
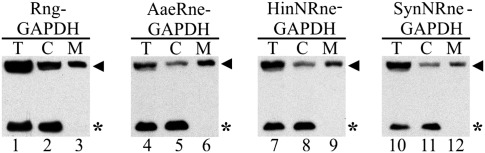
RNase E plays an essential role in RNA processing and decay and tethers to the cytoplasmic membrane in Escherichia coli; however, the function of this membrane-protein interaction has remained unclear. Here, we establish a mechanistic role for the RNase E-membrane interaction. The reconstituted highly conserved N-terminal fragment of RNase E (NRne, residues 1-499) binds specifically to anionic phospholipids through electrostatic interactions. The membrane-binding specificity of NRne was confirmed using circular dichroism difference spectroscopy; the dissociation constant (K(d)) for NRne binding to anionic liposomes was 298 nM. E. coli RNase G and RNase E/G homologs from phylogenetically distant Aquifex aeolicus, Haemophilus influenzae Rd, and Synechocystis sp. were found to be membrane-binding proteins. Electrostatic potentials of NRne and its homologs were found to be conserved, highly positive, and spread over a large surface area encompassing four putative membrane-binding regions identified in the "large" domain (amino acids 1-400, consisting of the RNase H, S1, 5'-sensor, and DNase I subdomains) of E. coli NRne. In vitro cleavage assay using liposome-free and liposome-bound NRne and RNA substrates BR13 and GGG-RNAI showed that NRne membrane binding altered its enzymatic activity. Circular dichroism spectroscopy showed no obvious thermotropic structural changes in membrane-bound NRne between 10 and 60 °C, and membrane-bound NRne retained its normal cleavage activity after cooling. Thus, NRne membrane binding induced changes in secondary protein structure and enzymatic activation by stabilizing the protein-folding state and increasing its binding affinity for its substrate. Our results demonstrate that RNase E-membrane interaction enhances the rate of RNA processing and decay.


Conflict of interest statement

The authors declare no conflict of interest.

Figures

Fig. 1.
Fig. 1.
The N- and C-terminal halves of E. coli RNase E have independent membrane-binding regions. Subcellular localization of endogenous E. coli FLRne (amino acids 1–1061) and ectopically expressed NRne (amino acids 1–499) or CRne (amino acids 500–1061). Aliquots containing equal amounts of total protein (T) and equivalent amounts of proteins from cytoplasmic (C) and membrane (M) fractions were separated on 10% SDS/PAGE. Western blotting was conducted as described in SI Materials and Methods. The bands corresponding to endogenous TolA, GAPDH, and FLRne and ectopically expressed NRne or CRne are indicated.
Fig. 2.
Fig. 2.
Binding of NRne to anionic liposomes occurs through electrostatic interactions and affects the conformation of the protein. (A) NRne–liposome binding spin assays using different types of phospholipids. NRne (16 μM) was mixed with neutral, anionic, or cationic liposomes (1.35 mg/mL) as described in SI Materials and Methods. The total reaction mixture (T), supernatant (S), and pellet (P) were separated by 10% SDS/PAGE and analyzed by Coomassie Blue staining. (B) NRne interacts specifically with anionic liposomes through electrostatic interaction. Individual pellets (P), as shown in A, were divided and suspended in 100 mM sodium carbonate or 1 M NaCl, incubated for 30 min on ice, and repelleted using the procedure described in SI Materials and Methods. The repellet and supernatant are denoted P1 and S1, respectively. (C and D) Detection of conformational changes in NRne bound to the different types of liposomes by CD difference spectroscopy using a specifically designed tandem cuvettete (see Fig. S1A and Materials and Methods for details). The mixture conditions of protein and individual types of liposomes are identical to those used in the spin assays shown in A. CD difference spectra corresponding to individual types of NRne–liposome mixtures are shown. The affinity of NRne and liposomes was calculated by monitoring conformational changes upon binding as observed by CD difference spectroscopy (Materials and Methods). NRne (1 μM) was mixed with different concentrations of liposomes (0–20 μM). Data were fitted to a one-site binding hyperbolic curve by OriginPro software and are presented as mean values with SDs calculated from three independent experiments. NRne binds to the anionic liposomes with a high affinity (solid line, Kd = 298 ± 29 nM). NRne mixed with cationic liposomes shows no binding (dashed line).
Fig. 3.
Fig. 3.
Calculation and mapping of the membrane-binding surface of NRne. (A) Electrostatic potentials of NRne. We used the 3D structures of the catalytic domain of E. coli RNase E (PDB ID codes 2VRT and 2C4R for the open and closed form of the enzyme, respectively) to calculate electrostatic potentials of NRne as described in SI Materials and Methods. Blue and red surface areas represent positive and negative equipotential contours, respectively. The positively charged surface (the region above the dashed line) likely approximates the extent of the envelope of the polar head group region of the membrane surface. NRne subdomains are indicated. The figure was produced using PyMol. (B) Subcellular localization of GAPDH-tagged E. coli RNase E polypeptides. Names of RNase E variants are indicated above each gel. Subscript numbers indicate the position of NRne amino acids that were fused with GAPDH. Cellular fractions were prepared and analyzed as described in the legend of Fig.1. The protein bands corresponding to plasmid-expressed GAPDH fusion polypeptides (◀) and endogenous GAPDH (*) are indicated. (C) The NRne fragment (amino acids 1–499) is shown divided into subdomains according to Callaghan et al. (11). The four putative NRne membrane-binding regions identified in our study are shown as gray rectangles. (D) Spin assay analyses of the binding of the DNase I subdomain to anionic liposomes. DNase I subdomain (16 μM) was mixed with anionic liposomes (1.35 mg/mL) as described in SI Materials and Methods. (Upper) The total reaction mixture (T), supernatant (S), and pellet (P) were separated by 15% SDS/PAGE and analyzed by Coomassie Blue staining. (Lower) The pellet (P) obtained in lane 6 (Upper) was divided and suspended in 100 mM sodium carbonate or 1 M NaCl, incubated for 30 min on ice, and repelleted as described in SI Materials and Methods. The repellet and supernatant are denoted as P1 and S1, respectively. (E) The DNase I subdomain binds specifically with anionic liposomes. Kd (solid line, Kd = 387 ± 34 nM) was calculated as described in the legend of Fig. 2. The DNase I subdomain shows no interaction with cationic liposomes DOPE/SA (dashed line).
Fig. 4.
Fig. 4.
RNase E/G homologs bind to the cytoplasmic membrane via the evolutionarily conserved catalytic domain of the enzyme. Subcellular distributions of GAPDH-fused derivatives including E. coli RNase G (Rng), RNase E/G homologs from A. aeolicus (AaeRne), and the putative catalytic domains of H. influenzae Rd (HinNRne, amino acids 1–418) and Synechocystis sp. (SynNRne, amino acids 1–396). Cellular fractions were prepared and analyzed as described in the legend of Fig.1. The bands corresponding to endogenous GAPDH (*) and ectopically expressed RNase E/G protein derivatives fused with GAPDH (◀) are indicated.
Fig. 5.
Fig. 5.
Binding to liposomes stabilizes the folding state of NRne and increases the enzymatic activity by increasing substrate affinity. (A and B) In vitro cleavage assays. As described in SI Materials and Methods, 20 pmol of BR13 or GGG-RNAI was incubated with 1 μg of liposome-free NRne (control) or liposome-bound (anionic liposomes) NRne at 37 °C. Aliquots taken after 2, 4, 6, 8, and 10 min (BR13) or 10, 20, 30, 40, and 50 min (GGG-RNAI) of incubation were separated on 20% or 8% sequencing gels, respectively. The position of bands corresponding to the substrates and products of cleavage are indicated at the left of each panel. (C) Michaelis–Menten analysis of BR13 cleavage by NRne in the presence (NRne+anionic liposomes) or absence (NRne) of anionic liposomes. The concentration of NRne was 2.5 nM in each sample; the concentration of substrate varied between 2.5 nM and 50 nM. The vo values reflecting the accumulation of cleavage product were fitted to a one-site binding hyperbolic curve using OriginPro software and are presented as mean values with SDs calculated from three independent experiments. (D) Thermally induced transition curves of NRne obtained by recording θ at 222 nm. The curves represented by filled and open circles correspond to the signal for NRne in the absence of anionic liposomes upon gradual temperature increase (from 10–60 °C, filled circles) or decrease (from 60–10 °C, open circles), respectively. The same measurements were performed for NRne in the presence of anionic liposomes (filled and open triangles, respectively). (E) Effect of temperature on CD spectra of NRne. Far UV CD spectra of NRne (amino acids 1–499) in the absence (line 1) and presence (line 3) of anionic liposomes as well as of anionic liposomes alone (line 5) were recorded at 25 °C. The samples were heated gradually to 60 °C and then were cooled; the CD spectra were recorded again at 25 °C (lines 2, 4, and 6, respectively). The compositions of the analyzed samples were the same as in the experiments presented in Fig. 2. (F) Thermal inactivation of NRne. Cleavage assays of BR13 were performed with NRne before (lane 1) and after (lane 2) thermal inactivation or with the liposome-bound variant before (lane 4) and after (lane 4) thermal inactivation using the NRne samples that were used for recording the CD spectra shown in D. The mixture conditions of protein and anionic liposomes are identical to those shown in A. Aliquots withdrawn after 4 min incubation were analyzed on a 20% sequencing gel.

References

    1. Cohen SN, McDowall KJ. RNase E: Still a wonderfully mysterious enzyme. Mol Microbiol. 1997;23:1099–1106. - PubMed
    1. Hagège JM, Cohen SN. A developmentally regulated Streptomyces endoribonuclease resembles ribonuclease E of Escherichia coli. Mol Microbiol. 1997;25:1077–1090. - PubMed
    1. Jäger S, et al. An mRNA degrading complex in Rhodobacter capsulatus. Nucleic Acids Res. 2001;29:4581–4588. - PMC - PubMed
    1. Kaberdin VR, et al. The endoribonucleolytic N-terminal half of Escherichia coli RNase E is evolutionarily conserved in Synechocystis sp. and other bacteria but not the C-terminal half, which is sufficient for degradosome assembly. Proc Natl Acad Sci USA. 1998;95:11637–11642. - PMC - PubMed
    1. Zeller ME, et al. Quaternary structure and biochemical properties of mycobacterial RNase E/G. Biochem J. 2007;403:207–215. - PMC - PubMed

Publication types

MeSH terms

LinkOut - more resources