. 2012 Apr 1;45(Pt 2):213-223.
doi: 10.1107/S0021889812000957. Epub 2012 Feb 9.

High-throughput biological small-angle X-ray scattering with a robotically loaded capillary cell

High-throughput biological small-angle X-ray scattering with a robotically loaded capillary cell

S S Nielsen et al. J Appl Crystallogr. .

Abstract

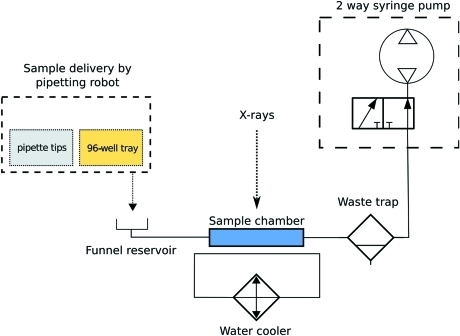
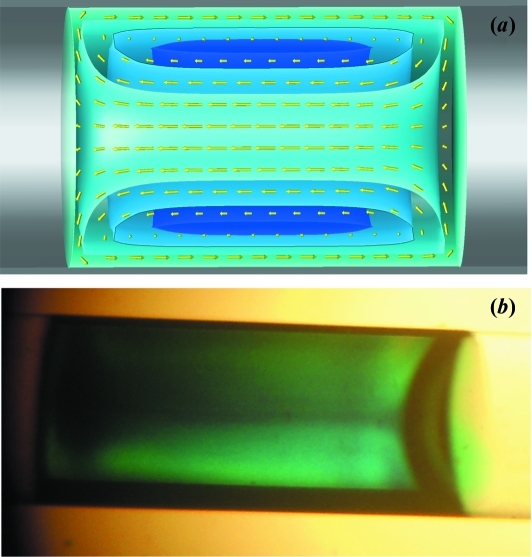
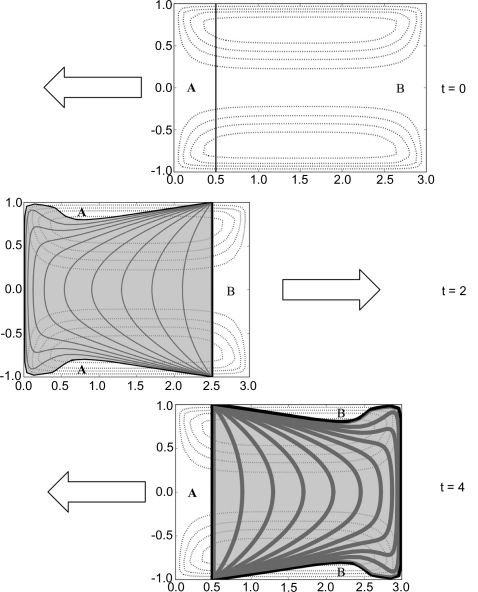
With the rise in popularity of biological small-angle X-ray scattering (BioSAXS) measurements, synchrotron beamlines are confronted with an ever-increasing number of samples from a wide range of solution conditions. To meet these demands, an increasing number of beamlines worldwide have begun to provide automated liquid-handling systems for sample loading. This article presents an automated sample-loading system for BioSAXS beamlines, which combines single-channel disposable-tip pipetting with a vacuum-enclosed temperature-controlled capillary flow cell. The design incorporates an easily changeable capillary to reduce the incidence of X-ray window fouling and cross contamination. Both the robot-control and the data-processing systems are written in Python. The data-processing code, RAW, has been enhanced with several new features to form a user-friendly BioSAXS pipeline for the robot. The flow cell also supports efficient manual loading and sample recovery. An effective rinse protocol for the sample cell is developed and tested. Fluid dynamics within the sample capillary reveals a vortex ring pattern of circulation that redistributes radiation-damaged material. Radiation damage is most severe in the boundary layer near the capillary surface. At typical flow speeds, capillaries below 2 mm in diameter are beginning to enter the Stokes (creeping flow) regime in which mixing due to oscillation is limited. Analysis within this regime shows that single-pass exposure and multiple-pass exposure of a sample plug are functionally the same with regard to exposed volume when plug motion reversal is slow. The robot was tested on three different beamlines at the Cornell High-Energy Synchrotron Source, with a variety of detectors and beam characteristics, and it has been used successfully in several published studies as well as in two introductory short courses on basic BioSAXS methods.


Figures

Figure 1
Figure 1
Schematic diagram of the automatic sample-loading system using standard hydraulic symbols. The robot pipettes the sample into the funnel and the sample is then drawn into the capillary sample chamber using the two-way syringe pump. After exposure, the sample passes into the waste trap vial.
Figure 2
Figure 2
Automated loading system as installed on the CHESS F2 beamline: (1) Hudson SOLO robot, (2) funnel to capillary, (3) sample cell camera, (4) angled mirror and (5) in-hutch sample cell monitor.
Figure 3
Figure 3
Sample cell enclosure with changeable capillary. Quartz capillaries are embedded in reusable aluminium rods sealed to the enclosure by means of piston-style O-rings (1). A funnel connected to the capillary by face-seal O-rings allows sample plugs as small as 5 µl to be loaded either manually or by pipetting robot (2). The sample is visible from above through a borosilicate window (3). KF40 bulkhead clamps connect the entire assembly to beampipe bellows to facilitate x–z alignment (not shown). The inner aluminium block is temperature regulated via a standard chilled-water connection (4).
Figure 4
Figure 4
Graphical user interface for Robocon control software. The sample can be adjusted dynamically during oscillation using the up/down arrows in the center panel. Stroke volume and pump speed are also dynamically adjustable. The volume of sample to be withdrawn from the 96-well tray is specified in the spreadsheet in the lower left. The interface also controls detector operation.
Figure 5
Figure 5
Reproducibility of scattering profiles for consecutively loaded 15 µl lysozyme buffer samples. Solid lines represent the average of 11 consecutive profiles, while open circles represent individual samples. For clarity, only every third profile (I 0, I 3, I 6, I 9) is shown and displaced horizontally. From load cycle to load cycle, buffer profiles are stable to within the detector/shot noise level of the experiment.
Figure 6
Figure 6
Computed versus experimental scattering data for ribonuclease A and glucose isomerase. SAXS envelopes, superimposed on known crystal structures, are obtained from the above scattering curves.
Figure 7
Figure 7
Intensity profiles from dilute BSA solution measured on three different CHESS beamlines: F2, G1 and G3. The solid black line is the scattering profile for the closest known structure to BSA, human serum albumin. Exposure times have been chosen so that all three curves have approximately the same signal levels. The inset shows a Guinier plot in the region qR g < 1.3. The G1 data show a slight concentration effect.
Figure 8
Figure 8
Effectiveness of sample cell rinse protocol. A series of five trial plugs of 7.8 mg ml−1 BSA solution were introduced into the sample cell, each separated by a cleaning of three plugs of 70 µl each of buffer followed by a final plug of buffer for comparison. The intensity profiles for the initial buffer (blue) and the buffer with the largest deviation from initial (trial No. 4 with χ2 = 0.77) (red) are shown superimposed in (a). For scale, BSA solution trial No. 4 is also shown in green. A plot of ΔI/σ for the residual protein intensity in the buffer for all five trials shows a barely perceptible upward trend at low angle, with few points above ΔI/σ = 2.0 (b). Residual protein signal is therefore not statistically significant after the cleaning protocol.
Figure 9
Figure 9
Fluid flow pattern within a 9.4 µl plug of water moving from right to left in a 2 mm-diameter capillary under air pressure. The simulated velocity field in the creeping flow limit (small Reynold’s number) shows a characteristic vortex ring pattern (yellow arrows) with toroidal-shaped isosurfaces of the stream function (levels of blue) in (a). The same flow pattern is made visible in an actual moving sample plug when tracer dye is added (b).
Figure 10
Figure 10
Simulated wake of X-ray-damaged material as a sample plug oscillates in the X-ray beam. Each plot represents the plug at a different time, with the arrows indicating the direction of future motion. The vertical line (aligned in all three plots) is where the X-ray beam traverses the sample. Dotted lines are contours of the stream function. The damaged region swept out by the beam is shaded gray and undamaged regions are labeled A and B. The line thickness represents degree of exposure.

References

    1. Berman, H. M., Westbrook, J., Feng, Z., Gilliland, G., Bhat, T. N., Weissig, H., Shindyalov, I. N. & Bourne, P. E. (2000). Nucleic Acids Res. 28, 235–242. - PMC - PubMed
    1. Byrnes, L. J. & Sondermann, H. (2011). Proc. Natl Acad. Sci. USA, 108, 2216–2221. - PMC - PubMed
    1. Castner, D. G. & Ratner, B. D. (2002). Surf. Sci. 500, 28–60.
    1. Chatani, E., Hayashi, R., Moriyama, H. & Ueki, T. (2002). Protein Sci. 11, 72–81. - PMC - PubMed
    1. Chu, B., Harney, P. J., Li, Y., Linliu, K., Yeh, F. & Hsiao, B. S. (1994). Rev. Sci. Instrum. 65, 597–602.