

Microarray analysis of gene expression in West Nile virus-infected human retinal pigment epithelium
- PMID: 22509103
- PMCID: PMC3324360
Microarray analysis of gene expression in West Nile virus-infected human retinal pigment epithelium
Abstract
Purpose: To identify key genes differentially expressed in the human retinal pigment epithelium (hRPE) following low-level West Nile virus (WNV) infection.
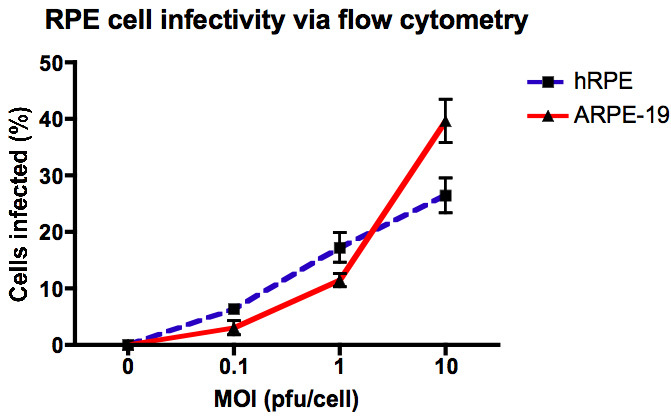
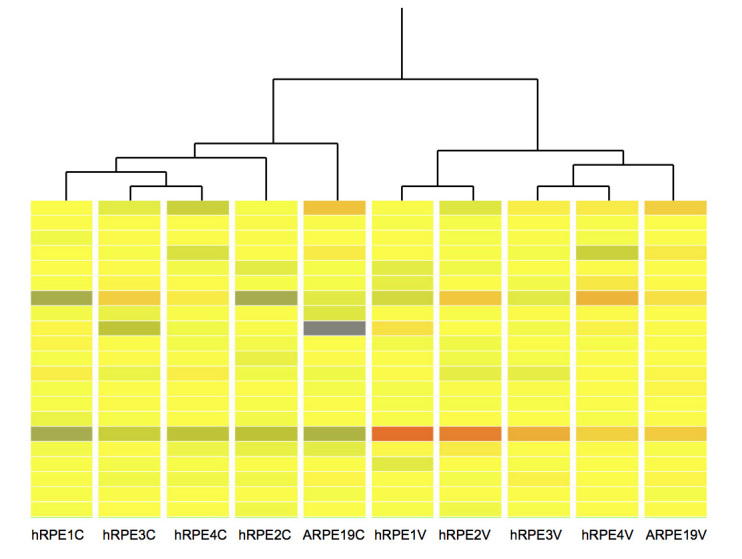
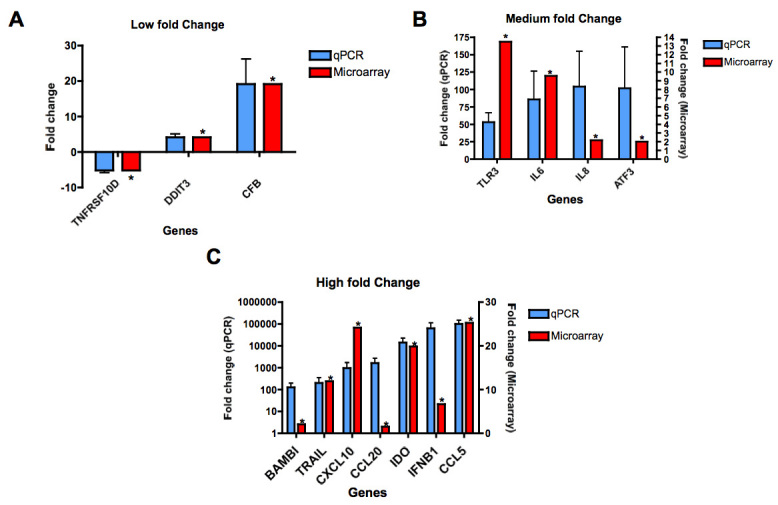
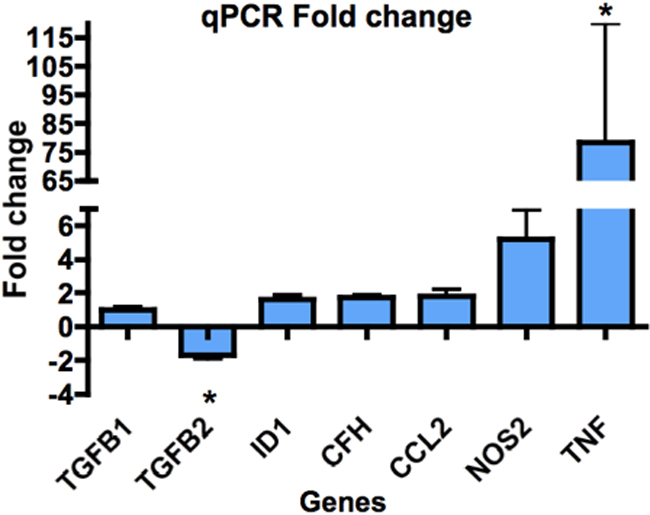
Methods: Primary hRPE and retinal pigment epithelium cell line (ARPE-19) cells were infected with WNV (multiplicity of infection 1). RNA extracted from mock-infected and WNV-infected cells was assessed for differential expression of genes using Affymetrix microarray. Quantitative real-time PCR analysis of 23 genes was used to validate the microarray results.
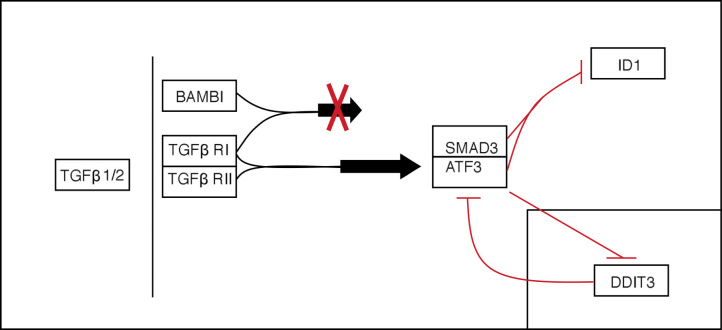
Results: Functional annotation clustering of the microarray data showed that gene clusters involved in immune and antiviral responses ranked highly, involving genes such as chemokine (C-C motif) ligand 2 (CCL2), chemokine (C-C motif) ligand 5 (CCL5), chemokine (C-X-C motif) ligand 10 (CXCL10), and toll like receptor 3 (TLR3). In conjunction with the quantitative real-time PCR analysis, other novel genes regulated by WNV infection included indoleamine 2,3-dioxygenase (IDO1), genes involved in the transforming growth factor-β pathway (bone morphogenetic protein and activin membrane-bound inhibitor homolog [BAMBI] and activating transcription factor 3 [ATF3]), and genes involved in apoptosis (tumor necrosis factor receptor superfamily, member 10d [TNFRSF10D]). WNV-infected RPE did not produce any interferon-γ, suggesting that IDO1 is induced by other soluble factors, by the virus alone, or both.
Conclusions: Low-level WNV infection of hRPE cells induced expression of genes that are typically associated with the host cell response to virus infection. We also identified other genes, including IDO1 and BAMBI, that may influence the RPE and therefore outer blood-retinal barrier integrity during ocular infection and inflammation, or are associated with degeneration, as seen for example in aging.
Figures
Similar articles
-
West Nile virus infection induces interferon signalling in human retinal pigment epithelial cells.Invest Ophthalmol Vis Sci. 2006 Feb;47(2):645-51. doi: 10.1167/iovs.05-1022. Invest Ophthalmol Vis Sci. 2006. PMID: 16431963
-
Human MicroRNA miR-532-5p Exhibits Antiviral Activity against West Nile Virus via Suppression of Host Genes SESTD1 and TAB3 Required for Virus Replication.J Virol. 2015 Dec 16;90(5):2388-402. doi: 10.1128/JVI.02608-15. J Virol. 2015. PMID: 26676784 Free PMC article.
-
Integrative RNA profiling of TBEV-infected neurons and astrocytes reveals potential pathogenic effectors.Comput Struct Biotechnol J. 2022 May 30;20:2759-2777. doi: 10.1016/j.csbj.2022.05.052. eCollection 2022. Comput Struct Biotechnol J. 2022. PMID: 35685361 Free PMC article.
-
Interleukins, Chemokines, and Tumor Necrosis Factor Superfamily Ligands in the Pathogenesis of West Nile Virus Infection.Viruses. 2023 Mar 22;15(3):806. doi: 10.3390/v15030806. Viruses. 2023. PMID: 36992514 Free PMC article. Review.
-
Chemokine control of West Nile virus infection.Exp Cell Res. 2011 Mar 10;317(5):569-74. doi: 10.1016/j.yexcr.2011.01.009. Exp Cell Res. 2011. PMID: 21376172 Free PMC article. Review.
Cited by
-
Molecular Responses of Human Retinal Cells to Infection with Dengue Virus.Mediators Inflamm. 2017;2017:3164375. doi: 10.1155/2017/3164375. Epub 2017 Nov 12. Mediators Inflamm. 2017. PMID: 29515292 Free PMC article.
-
Basic insights into Zika virus infection of neuroglial and brain endothelial cells.J Gen Virol. 2020 Jun;101(6):622-634. doi: 10.1099/jgv.0.001416. Epub 2020 Apr 28. J Gen Virol. 2020. PMID: 32375993 Free PMC article.
-
Infection of Human Retinal Pigment Epithelium with Chlamydia trachomatis.PLoS One. 2015 Nov 4;10(11):e0141754. doi: 10.1371/journal.pone.0141754. eCollection 2015. PLoS One. 2015. PMID: 26536616 Free PMC article.
-
Specific correlation between the major chromosome 10q26 haplotype conferring risk for age-related macular degeneration and the expression of HTRA1.Mol Vis. 2017 Jun 14;23:318-333. eCollection 2017. Mol Vis. 2017. PMID: 28659708 Free PMC article.
-
Inflammatory responses to a pathogenic West Nile virus strain.BMC Infect Dis. 2019 Oct 29;19(1):912. doi: 10.1186/s12879-019-4471-8. BMC Infect Dis. 2019. PMID: 31664929 Free PMC article.
References
-
- Petersen LR, Hayes EB. West Nile Virus in the Americas. Med Clin North Am. 2008;92:1307–22. - PubMed
-
- Mostashari F, Bunning ML, Kitsutani PT, Singer DA, Nash D, Cooper MJ, Katz N, Liljebjelke KA, Biggerstaff BJ, Fine AD, Layton MC, Mullin SM, Johnson AJ, Martin DA, Hayes EB, Campbell GL. Epidemic West Nile encephalitis, New York, 1999: Results of a Household-based Sero-epidemiological Survey. Lancet. 2001;358:261–4. - PubMed
-
- Petersen LR, Marfin AA. West Nile virus: a primer for the clinician. Ann Intern Med. 2002;137:173–9. - PubMed
-
- Garg S, Jampol LM. Systemic and intraocular manifestations of West Nile virus infection. Surv Ophthalmol. 2005;50:3–13. - PubMed
-
- Khairallah M, Ben Yahia S, Ladjimi A, Zeghidi H, Ben Romdhane F, Besbes L, Zaouali S, Messaoud R. Chorioretinal involvement in patients with West Nile virus infection. Ophthalmology. 2004;111:2065–70. - PubMed
Publication types
MeSH terms
Substances
LinkOut - more resources
Full Text Sources
Molecular Biology Databases
Research Materials
Miscellaneous