. 2012;10(4):e1001301.
doi: 10.1371/journal.pbio.1001301. Epub 2012 Apr 3.

Stitching together multiple data dimensions reveals interacting metabolomic and transcriptomic networks that modulate cell regulation

Affiliations

Stitching together multiple data dimensions reveals interacting metabolomic and transcriptomic networks that modulate cell regulation

Jun Zhu et al. PLoS Biol. 2012.

Abstract

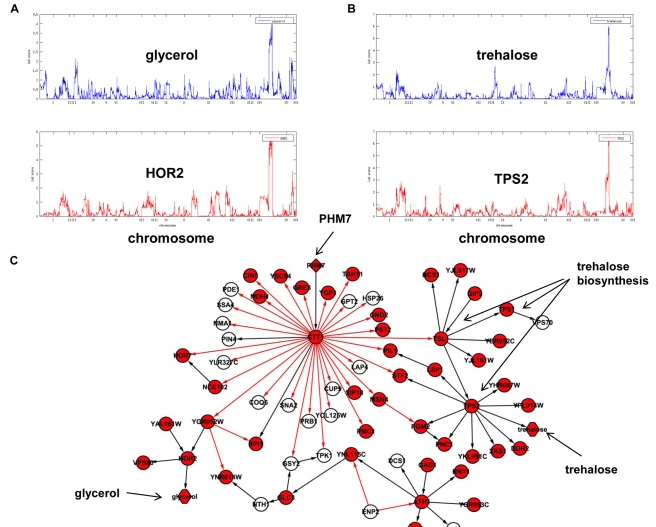
Cells employ multiple levels of regulation, including transcriptional and translational regulation, that drive core biological processes and enable cells to respond to genetic and environmental changes. Small-molecule metabolites are one category of critical cellular intermediates that can influence as well as be a target of cellular regulations. Because metabolites represent the direct output of protein-mediated cellular processes, endogenous metabolite concentrations can closely reflect cellular physiological states, especially when integrated with other molecular-profiling data. Here we develop and apply a network reconstruction approach that simultaneously integrates six different types of data: endogenous metabolite concentration, RNA expression, DNA variation, DNA-protein binding, protein-metabolite interaction, and protein-protein interaction data, to construct probabilistic causal networks that elucidate the complexity of cell regulation in a segregating yeast population. Because many of the metabolites are found to be under strong genetic control, we were able to employ a causal regulator detection algorithm to identify causal regulators of the resulting network that elucidated the mechanisms by which variations in their sequence affect gene expression and metabolite concentrations. We examined all four expression quantitative trait loci (eQTL) hot spots with colocalized metabolite QTLs, two of which recapitulated known biological processes, while the other two elucidated novel putative biological mechanisms for the eQTL hot spots.


Conflict of interest statement

I have read the journal's policy and have the following conflicts. The work was partially funded by Merck.

Figures

Figure 1
Figure 1. Overview of the experimental design.
A cross between laboratory (BY) and wild (RM) strains of S. cerevisiae was gene expression profiled. Metabolites were profiled under the same conditions. These data were then integrated with genotype data along with information from public databases to derive a BN. The derived network was used to analyze how cells are regulated.
Figure 2
Figure 2. Distributions of metabolite concentrations between parental strains and among 120 segregants of a cross between laboratory (BY) and wild (RM) strains of S. cerevisiae .
The y-axis is metabolite concentrations (nanomoles per yeast cell). The genotypes for segregants are reported at the loci to which the metabolite concentrations were linked. Represented are the metabolites (A) 2-isopropylmalate; (B) orotic acid; (C) SAH; and (D) threonine.
Figure 3
Figure 3. Relationship between 2-isoproplymalate and genes linked to eQTL hot spot 1 on Chromosome III.
(A) 2-isopropylmalate is an intermediate metabolite in the leucine biosynthesis pathway and LEU2 is a key enzyme in this pathway; (B) 2-isopropylmalate concentrations are linked to the LEU2 locus and is reactive to LEU2 expression; (C) 2-isopropylmalate is reactive to LEU2 and causal for genes with Leu3p binding sites (red nodes); (D) a zoomed-in view of the subnetwork highlighted in (C) (around 2-isopropylmalate). Hexagon-shaped nodes represent metabolites, circular nodes represent genes, and diamond-shaped nodes represent genes with cis-eQTLs.
Figure 4
Figure 4. Relationship between metabolites and genes linked to eQTL hot spot 2 on Chromosome V.
(A) De novo biosynthesis of pyrimidine pathway; (B) orotic acid and dihydroorotic acid concentrations are linked to the URA3 locus; (C) URA3 is predicted as the causal regulator for genes and metabolites linked to the eQTL hot spot. Red nodes are genes or metabolites whose variations are linked the Chromosome V locus. The shapes of the nodes follow the convention described in Figure 3.
Figure 5
Figure 5. Genes and metabolites linked to eQTL hot spot 3 on Chromosome XIII.
(A) Variations of the metabolites isoleucine and threonine are linked to this locus. (B) These two subnetworks comprise genes and metabolites enriched for linking to the Chromosome XIII locus. The larger network consists of both gene expression and metabolite nodes enriched for the GO biological process nitrogen compound metabolism. The smaller network is enriched for the GO biological process de novo IMP biosynthetic process. Red nodes are genes with eQTLs linked to the Chromosome 13 locus. (C) Expression levels of eight genes (in red) are different between VPS9 knockout and the wild-type strains. The shapes of the nodes follow the convention described in Figure 3.
Figure 6
Figure 6. Metabolite subnetwork.
(A) Variations in valine concentrations are linked to two eQTL hot spots; Chromosome III:100,000 and Chromosome XIII:70,000. (B) Most metabolites are connected. Valine connects to metabolites linked to eQTL hot spots at Chromosome III:100,000 (nodes in blue) and Chromosome XIII:70,000 (nodes in green). (C) 25 metabolites (in red) whose concentrations are different between VPS9 knockout and the wild-type strains are in this subnetwork. This structure suggests that VPS9 is causal for the variations of these metabolites. The shapes of the nodes follow the convention described in Figure 3.
Figure 7
Figure 7. Genes and metabolites linked to eQTL hot spot 4 on Chromosome XV.
(A) Variations in the metabolites glycerol and (B) trehalose are linked to this eQTL hot spot. (C) The part of the subnetwork associated with this eQTL hot spot consists of the causal regulator PHM7 at the top, key TFs MSN4 and MSN2 (represented by CTT1), and the genes that encode for the trehalose synthesase complex. Red nodes are genes or metabolites with QTL linked to the Chromosome XV locus.
Figure 8
Figure 8. The PHM7 knockout metabolite signature suggests interconnectivity of multiple eQTL hot spots.
(A) The metabolite subnetwork is the same as the subnetwork depicted in Figure 6A. 27 metabolites (in red) whose concentrations differ between the PHM7 knockout and the wild-type strains are in this subnetwork. In addition to trehalose, which is linked to the eQTL hot spot 4, the PHM7 knockout metabolite signature includes metabolites whose concentrations are linked to eQTL hot spots 1 and 3 (on Chromosomes III and XIII, respectively), suggesting interactions among eQTL hot spots 1, 3 and 4, as we have previously predicted . (B) The subnetworks for eQTL hot spot 4 (extracted using genes linked to eQTL hot spot 4) suggests that part of this network is regulated by both eQTL hot spots 2 and 4. Red nodes are genes whose expression values are linked to eQTL hot spot 2. (C) A zoomed-in view of the part of the network regulated by eQTL hot spots 2 and 4. The gene that links this part of the network to the rest of the subnetwork associated with eQTL hot spot 4 is GCN4, a master TF regulating amino acid biosynthesis.

Comment in

Similar articles

Cited by

References

    1. Altshuler D, Daly M. J, Lander E. S. Genetic mapping in human disease. Science. 2008;322:881–888. - PMC - PubMed
    1. Chen Y, Zhu J, Lum P. Y, Yang X, Pinto S, et al. Variations in DNA elucidate molecular networks that cause disease. Nature. 2008;452:429–435. - PMC - PubMed
    1. Emilsson V, Thorleifsson G, Zhang B, Leonardson A. S, Zink F, et al. Genetics of gene expression and its effect on disease. Nature. 2008;452:423–428. - PubMed
    1. Witte J. S. Genome-wide association studies and beyond. Annu Rev Public Health. 31:9–20. 24 p following 20. - PMC - PubMed
    1. Hsu Y. H, Zillikens M. C, Wilson S. G, Farber C. R, Demissie S, et al. An integration of genome-wide association study and gene expression profiling to prioritize the discovery of novel susceptibility Loci for osteoporosis-related traits. PLoS Genet. 6:e1000977. doi: 10.1371/journal.pgen.1000977. - DOI - PMC - PubMed

MeSH terms

LinkOut - more resources