. 2012;7(4):e32715.
doi: 10.1371/journal.pone.0032715. Epub 2012 Apr 11.

Specific roles of Akt iso forms in apoptosis and axon growth regulation in neurons

Affiliations

Specific roles of Akt iso forms in apoptosis and axon growth regulation in neurons

Hector Diez et al. PLoS One. 2012.

Abstract

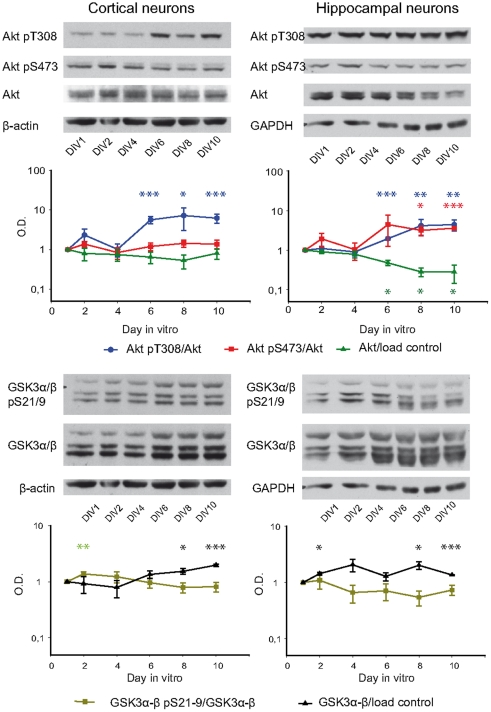
Akt is a member of the AGC kinase family and consists of three isoforms. As one of the major regulators of the class I PI3 kinase pathway, it has a key role in the control of cell metabolism, growth, and survival. Although it has been extensively studied in the nervous system, we have only a faint knowledge of the specific role of each isoform in differentiated neurons. Here, we have used both cortical and hippocampal neuronal cultures to analyse their function. We characterized the expression and function of Akt isoforms, and some of their substrates along different stages of neuronal development using a specific shRNA approach to elucidate the involvement of each isoform in neuron viability, axon development, and cell signalling. Our results suggest that three Akt isoforms show substantial compensation in many processes. However, the disruption of Akt2 and Akt3 significantly reduced neuron viability and axon length. These changes correlated with a tendency to increase in active caspase 3 and a decrease in the phosphorylation of some elements of the mTORC1 pathway. Indeed, the decrease of Akt2 and more evident the inhibition of Akt3 reduced the expression and phosphorylation of S6. All these data indicate that Akt2 and Akt3 specifically regulate some aspects of apoptosis and cell growth in cultured neurons and may contribute to the understanding of mechanisms of neuron death and pathologies that show deregulated growth.


Conflict of interest statement

Competing Interests: The authors have declared that no competing interests exist.

Figures

Figure 1
Figure 1. Akt isoforms levels change during neuron development.
A. Ex vivo evolution of the isoforms of Akt in cortical (left) and hippocampal (right) neuron cultures at 1, 2, 4, 6, 8 and 10 days in vitro (DIV). Cell extracts were obtained as described in Methods, and Western blots analysed with specific antibodies against each isoform. β-actin was used as loading control for cortical neurons and GAPDH for hippocampal neurons. Western blots were quantified and normalised with respect to the control protein as indicated. The data from 1 DIV was always considered as 1 relative unit and the values are represented in logarithmic scale. The graphs represent three independent experiments (each point represents mean ± SEM). Samples were compared to 1 DIV using Student's t test; *: p<0.05; **: p<0.01; ***: p<0.001. In cortical neurons Akt2 and Akt3 levels were reduced from 4 DIV on and Akt1 changes slightly at 4 DIV–6 DIV. In hippocampal neurons, Akt1 levels decreased from 6 DIV on, Akt2 showed a tendency to reduction from 4 DIV on (which is statistically significant at 4 DIV and 6 DIV) an Akt3 is slightly increased at 2–4 DIV. B. Subcellular distribution of Akt isoforms. Total extract from cortical neurons was fractionated as indicated in Methods. For each sample (membrane, citosol and nucleus) the presence of Akt isoforms was determined by Western blot. Lamin B1 was used as marker and loading control for the nuclear fraction and GAPDH for the cytosolic fraction. Note that Akt3 showed a relatively higher nuclear proportion than the other isoforms.
Figure 2
Figure 2. Evolution of the Akt-GSK3 pathway during neuron development.
The presence of Akt and GSK3 and their phosphorylation levels were analysed in cortical (left) and hippocampal (right) neuron cultures at 1, 2, 4, 6, 8 and 10 day in vitro (DIV). The cell extract was analysed by Western blot using antibodies against pan-Akt, Akt pT308, Akt pS473, GSK3α/β and GSK3α/β pS21/9. β-actin was used as load control for cortical neurons and GAPDH for hippocampal neurons. Western blots were quantified and normalised with respect the control protein as indicated in Figure 1, and the values are represented in logarithmic scale. The graphs represent three independent experiments (each point represents mean ± SEM). Samples were compared to 1 DIV using Student's t test; *: p<0.05; **: p<0.01; ***: p<0.001. Note that Akt activating phosphorylations were increased during both cortical and hippocampal neuron development from 6 DIV on but no correlation was observed with the phosphorylation status of its substrate GSK3α/β. Total levels of GSK3α/β increased during development in both types of cultures.
Figure 3
Figure 3. Evolution of mTORC1 substrates during neuron cultures.
Elements of this pathway were analysed in cortical (left) and hippocampal (right) neuron cultures at 1, 2, 4, 6, 8 and 10 day in vitro (DIV). Cell extracts were evaluated using antibodies against S6K1, S6K1 pT389, S6, S6 pS235/236, 4EBP1 and 4EBP1 pT37/46. β-actin was used as load control for cortical neurons and GAPDH for hippocampal neurons. Western blots were quantified and normalised with respect the control protein as indicated in Figure 1, and the values are represented in logarithmic scale. The graphs represent three independent experiments (each point represents mean ± SEM). Samples were compared to DIV1 using Student's t test; *: p<0.05; **: p<0.01; ***: p<0.001. Although the mTORC1 phosphorylation on 4EBP1 remained stable in both kind of cultures, in cortical neurons S6K1 pT389 decreased on 6–8 DIV, and its substrate S6 pS235/236 showed a tendency to reduction beginning on 6 DIV. In hippocampal cultures, S6K1 pT389 was reduced on 10 DIV and its substrate S6 pS235/236 decreased on 8–10 DIV.
Figure 4
Figure 4. Akt isoforms differentially regulate neuron survival.
Cortical neurons were infected with lentiviral vectors containing shRNAs at 1 DIV for six hours (A–D). As a control of the effect of total Akt inhibition, neurons were treated with the Akt inhibitor VIII 5 µM from 1 DIV (D_E). The viability was assayed using a propidium iodide-calcein assay performed on 4 DIV. A. Representative photographs for shRNA containing lentiviral infection. B. Percentage of viable cells (Calcein-positive). Each sample was compared to control (ShC) using Student's t test (bars represent mean ± standard deviation; *: p<0.05). Note that the disruption of Akt2 and Akt3 caused a significant reduction on neuron viability. C. ShRNA interference was confirmed at 4 DIV by inhibition of protein expression using specific antibodies. Apoptosis was evaluated at 4 DIV by the presence of active caspase 3 associated to shRNA-induced Akt2 and Akt3 reduction (Lower panel). D. To identify the maximal effect due to Akt inhibition, in parallel we treated neurons with for Akt inhibitor VIII (5 µ m). Representative photographs for Akt inhibitor VIII treatments. The graphs correspond to the quantitative determination of viable neurons, either after inhibitor VIII or DMSO treatments (represented as percentage of calcein-positive cell). In each independent experiment (n=3), data from Akt-VIII was compared to control (DMSO) using Student's t test (bars represent mean ± standard deviation; **: p<0.01). E. Inhibition of Akt was confirmed at 4 DIV by reduction of Akt activating phosphorylation levels (Akt pT308 and Akt pS473). And the maximal level of apoptosis was evaluated at 4 DIV (right panel), by the presence of active caspase 3 associated to Akt-VIII inhibitor (Akt-I).
Figure 5
Figure 5. Akt isoforms differentially regulate axon growth but do not affect axon establishment.
Hippocampal neurons were nucleofected with the indicated shRNAs and a GFP-expressing plasmid, and analysed later on DIV 3. A. Neurons were fixed and anti-Tau-1 antibody was used as an axonal marker. The photographs correspond to a representative field for each experimental condition in which the Tau-1 positive and/or GFP-positive neurons were observed. Scale bar: 25 µm. B. Data indicated that Akt isoforms disruption did not induce a statistically significant change in neuron polarity (each condition was compared to control using Student's t test; bars represent mean ± standard deviation). C. However, when the axonal length were determined (form those GFP-positive and Tau-1-positve neurons), the disruption of both Akt2 and Akt3 caused a reduction of axon length (samples were compared to control using Mann-Withney test as they did not show a normal distribution; bars represent mean ± SEM; **: p<0.01, ***: p<0.001).
Figure 6
Figure 6. Regulation of Akt-GSK3 pathway by Akt isoforms.
Cortical neurons were infected with lentiviral vectors containing shRNA at two times (1 DIV and 6 DIV) for six hours. 72 h after the infection cell extracts were obtained (at 4 DIV and 9 DIV respectively). A. As an internal control, shRNA induced interference was confirmed by protein expression using specific antibodies against each Akt isoform. B. The effect of Akt interference was analysed using antibodies against Akt and GSK3: pan-Akt, Akt pT308, Akt pS473, GSK3α/β and GSK3α/β pS21/9. β-actin was used as load control. Akt1 and Akt3 may be identified as two different bands marked by the pan-Akt antibody. Although Akt2 disruption caused a slight decrease in Akt pT308, no other significant changes are observed.
Figure 7
Figure 7. Regulation of mTORC1 substrates by Akt isoforms.
Cortical neurons were infected with lentiviral vectors containing shRNA at two times (1 DIV and 6 DIV) for six hours; proteins were extracted 72 h after the infection (at 4 DIV and 9 DIV respectively). The cell extract was examined using antibodies against the canonical substrates of mTORC1 pathway: p70 S6K1, p70 S6K1 pT389, S6, S6 pS235/236, 4EBP1 and 4EBP1 pT37/46. β-actin was used as load control. The interference was confirmed by protein expression using specific antibodies as previously indicated (see Figure 6A ). A. Note that Akt2 and Akt3 regulated S6 phosphorylation but no statistical change was observed in the direct mTORC1 substrates S6K1 and 4EBP1. B. The relative level S6 pS235/236 with respect to the total S6 was determined, at 4 DIV by Western blot (each condition was compared to control using Student's t test; bars represent mean ± standard deviation).

References

    1. Pearce LR, Komander D, Alessi DR. The nuts and bolts of AGC protein kinases. Nat Rev Mol Cell Biol. 2010;11:9–22. - PubMed
    1. Staal SP. Molecular cloning of the akt oncogene and its human homologues AKT1 and AKT2: amplification of AKT1 in a primary human gastric adenocarcinoma. Proc Natl Acad Sci U S A. 1987;84:5034–5037. - PMC - PubMed
    1. Manning BD, Cantley LC. AKT/PKB signaling: navigating downstream. Cell. 2007;129:1261–1274. - PMC - PubMed
    1. Dummler B, Hemmings BA. Physiological roles of PKB/Akt isoforms in development and disease. Biochem Soc Trans. 2007;35:231–235. - PubMed
    1. Yang ZZ, Tschopp O, Baudry A, Dummler B, Hynx D, et al. Physiological functions of protein kinase B/Akt. Biochem Soc Trans. 2004;32:350–354. - PubMed

Publication types

MeSH terms