

The immune cell composition in Barrett's metaplastic tissue resembles that in normal duodenal tissue
- PMID: 22509265
- PMCID: PMC3317926
- DOI: 10.1371/journal.pone.0033899
The immune cell composition in Barrett's metaplastic tissue resembles that in normal duodenal tissue
Abstract
Background and objective: Barrett's esophagus (BE) is characterized by the transition of squamous epithelium into columnar epithelium with intestinal metaplasia. The increased number and types of immune cells in BE have been indicated to be due to a Th2-type inflammatory process. We tested the alternative hypothesis that the abundance of T-cells in BE is caused by a homing mechanism that is found in the duodenum.
Patients and methods: Biopsies from BE and duodenal tissue from 30 BE patients and duodenal tissue from 18 controls were characterized by immmunohistochemistry for the presence of T-cells and eosinophils(eos). Ex vivo expanded T-cells were further phenotyped by multicolor analysis using flowcytometry.
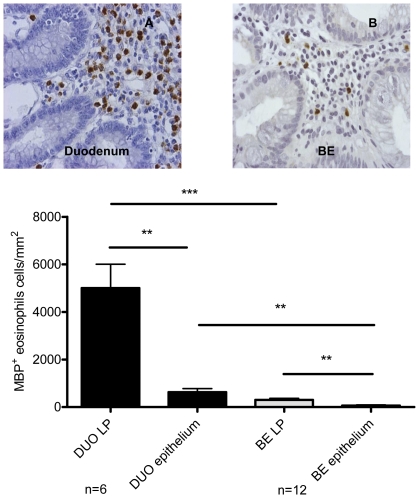
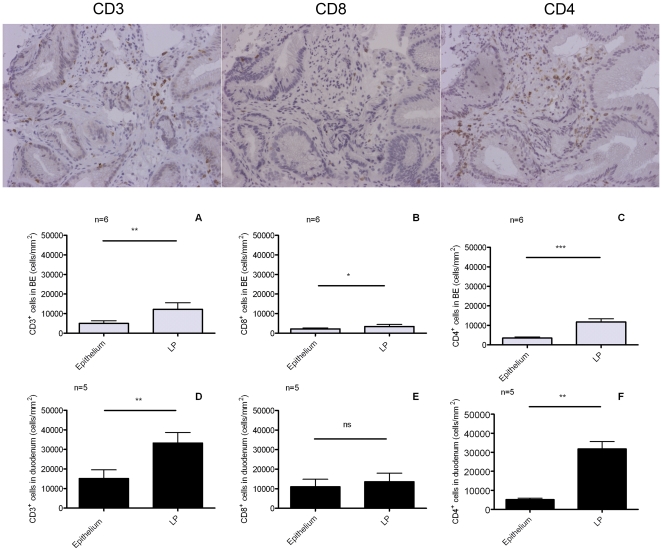
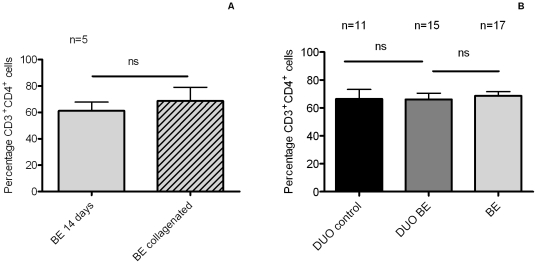
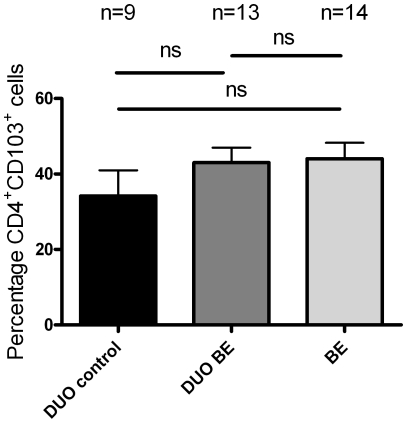
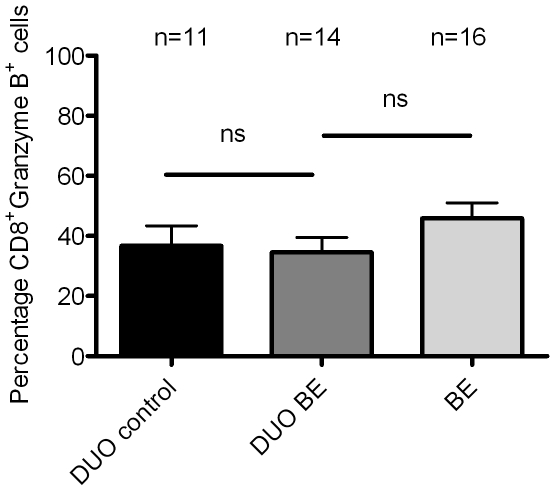
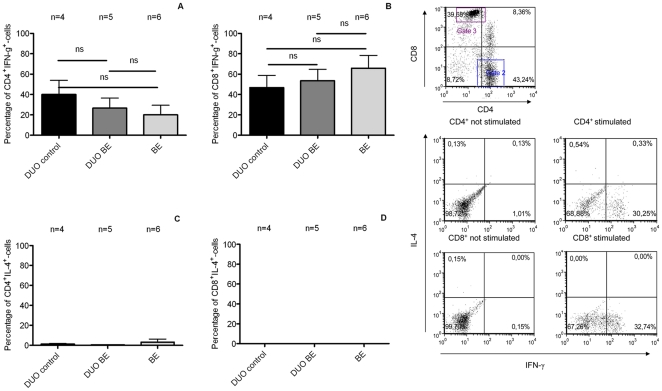
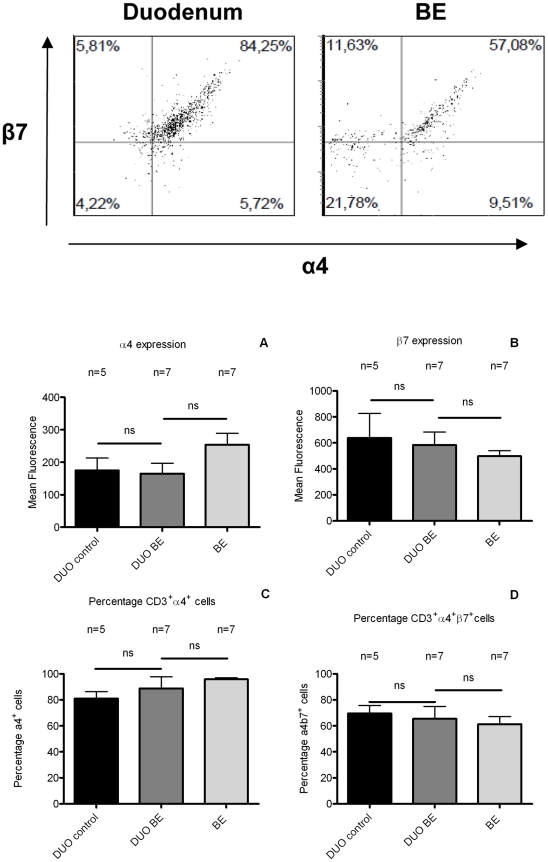
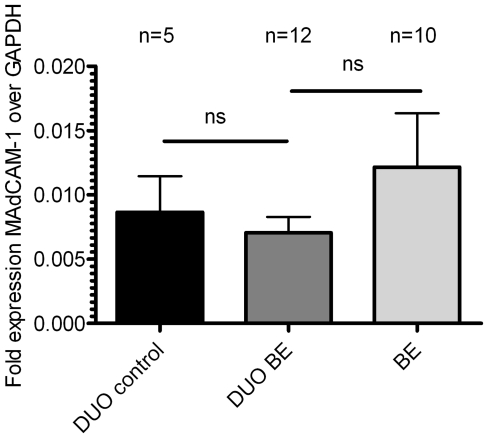
Results: The high percentage of CD4(+)-T cells (69±3% (mean±SEM/n = 17, by flowcytometry)), measured by flowcytometry and immunohistochemistry, and the presence of non-activated eosinophils found in BE by immunohistochemical staining, were not different from that found in duodenal tissue. Expanded lymphocytes from these tissues had a similar phenotype, characterized by a comparable but low percentage of αE(CD103) positive CD4(+)cells (44±5% in BE, 43±4% in duodenum of BE and 34±7% in duodenum of controls) and a similar percentage of granzyme-B(+)CD8(+) cells(44±5% in BE, 33±6% in duodenum of BE and 36±7% in duodenum of controls). In addition, a similar percentage of α4β7(+) T-lymphocytes (63±5% in BE, 58±5% in duodenum of BE and 62±8% in duodenum of controls) was found. Finally, mRNA expression of the ligand for α4β7, MAdCAM-1, was also similar in BE and duodenal tissue. No evidence for a Th2-response was found as almost no IL-4(+)-T-cells were seen.
Conclusion: The immune cell composition (lymphocytes and eosinophils) and expression of intestinal adhesion molecule MAdCAM-1 is similar in BE and duodenum. This supports the hypothesis that homing of lymphocytes to BE tissue is mainly caused by intestinal homing signals rather than to an active inflammatory response.
Conflict of interest statement
Figures
Similar articles
-
Squamous tissue lymphocytes in the esophagus of controls and patients with reflux esophagitis and Barrett's esophagus are characterized by a non-inflammatory phenotype.PLoS One. 2014 Aug 29;9(8):e106261. doi: 10.1371/journal.pone.0106261. eCollection 2014. PLoS One. 2014. PMID: 25170842 Free PMC article. Clinical Trial.
-
Regulation and Role of αE Integrin and Gut Homing Integrins in Migration and Retention of Intestinal Lymphocytes during Inflammatory Bowel Disease.J Immunol. 2021 Nov 1;207(9):2245-2254. doi: 10.4049/jimmunol.2100220. Epub 2021 Sep 24. J Immunol. 2021. PMID: 34561227 Free PMC article.
-
Cdx-2 expression in squamous and metaplastic columnar epithelia of the esophagus.Dis Esophagus. 2006;19(4):260-6. doi: 10.1111/j.1442-2050.2006.00586.x. Dis Esophagus. 2006. PMID: 16866857
-
Increased expression of mucosal addressin cell adhesion molecule 1 in the duodenum of patients with active celiac disease is associated with depletion of integrin alpha4beta7-positive T cells in blood.Hum Pathol. 2009 May;40(5):699-704. doi: 10.1016/j.humpath.2008.10.014. Epub 2009 Jan 20. Hum Pathol. 2009. PMID: 19157500
-
The biopsy diagnosis of gastroesophageal reflux disease, "carditis," and Barrett's esophagus, and sequelae of therapy.Am J Surg Pathol. 1996;20 Suppl 1:S31-50. doi: 10.1097/00000478-199600001-00005. Am J Surg Pathol. 1996. PMID: 8694147 Review.
Cited by
-
Current state of prognostication, therapy and prospective innovations for Barrett's-related esophageal adenocarcinoma: a literature review.J Gastrointest Oncol. 2021 Aug;12(4):1197-1214. doi: 10.21037/jgo-21-117. J Gastrointest Oncol. 2021. PMID: 34532080 Free PMC article. Review.
-
From microbes to medicine: harnessing the power of the microbiome in esophageal cancer.Front Immunol. 2024 Nov 12;15:1450927. doi: 10.3389/fimmu.2024.1450927. eCollection 2024. Front Immunol. 2024. PMID: 39600698 Free PMC article. Review.
-
The characterization of an intestine-like genomic signature maintained during Barrett's-associated adenocarcinogenesis reveals an NR5A2-mediated promotion of cancer cell survival.Sci Rep. 2016 Sep 2;6:32638. doi: 10.1038/srep32638. Sci Rep. 2016. PMID: 27586588 Free PMC article.
-
The Microenvironment in Barrett's Esophagus Tissue Is Characterized by High FOXP3 and RALDH2 Levels.Front Immunol. 2018 Jun 18;9:1375. doi: 10.3389/fimmu.2018.01375. eCollection 2018. Front Immunol. 2018. PMID: 29967615 Free PMC article.
-
Toll-like receptor 4 activation in Barrett's esophagus results in a strong increase in COX-2 expression.J Gastroenterol. 2014 Jul;49(7):1121-34. doi: 10.1007/s00535-013-0862-6. Epub 2013 Aug 17. J Gastroenterol. 2014. PMID: 23955118
References
-
- Pohl H, Welch HG. The role of overdiagnosis and reclassification in the marked increase of esophageal adenocarcinoma incidence. J Natl Cancer Inst. 2005;97:142. - PubMed
-
- Spechler SJ. Barrett's esophagus. Curr Opin Gastroenterol. 1999;15:352. - PubMed
-
- Rastogi AS, Puli HB, El-Serag A, Bansal S, Wani, et al. Incidence of esophageal adenocarcinoma in patients with Barrett's esophagus and high-grade dysplasia: a meta-analysis. Gastrointest Endosc. 2008;67:394. - PubMed
-
- Whittles CELR, Biddlestone A, Burton H, Barr JA, Jankowski PJ, et al. Apoptotic and proliferative activity in the neoplastic progression of Barrett's oesophagus: a comparative study. J Pathol. 1999;187:535. - PubMed
-
- Wang KK, Sampliner RE. Updated guidelines 2008 for the diagnosis, surveillance and therapy of Barrett's esophagus. Am J Gastroenterol. 2008;103:788. - PubMed
Publication types
MeSH terms
Substances
LinkOut - more resources
Full Text Sources
Research Materials
