. 2012;7(4):e34267.
doi: 10.1371/journal.pone.0034267. Epub 2012 Apr 3.

Cryptic distant relatives are common in both isolated and cosmopolitan genetic samples

Affiliations

Cryptic distant relatives are common in both isolated and cosmopolitan genetic samples

Brenna M Henn et al. PLoS One. 2012.

Abstract

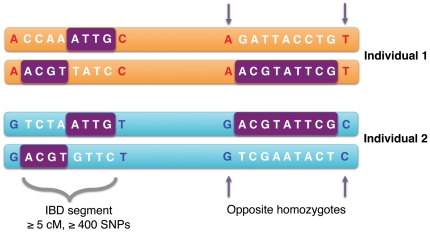
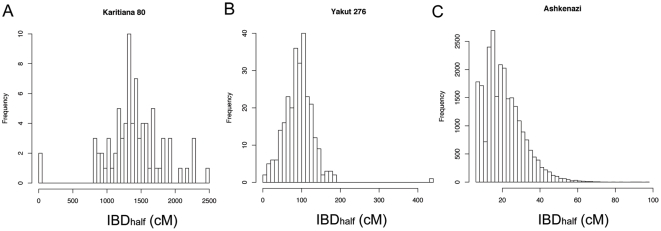
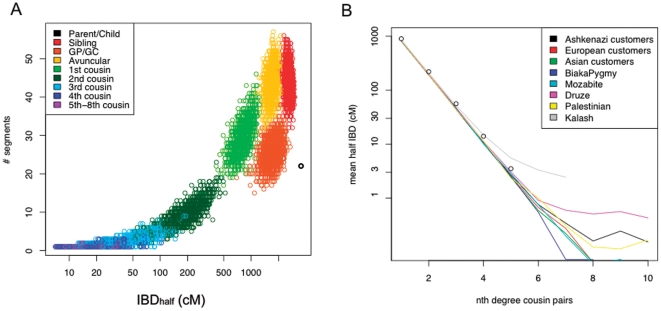
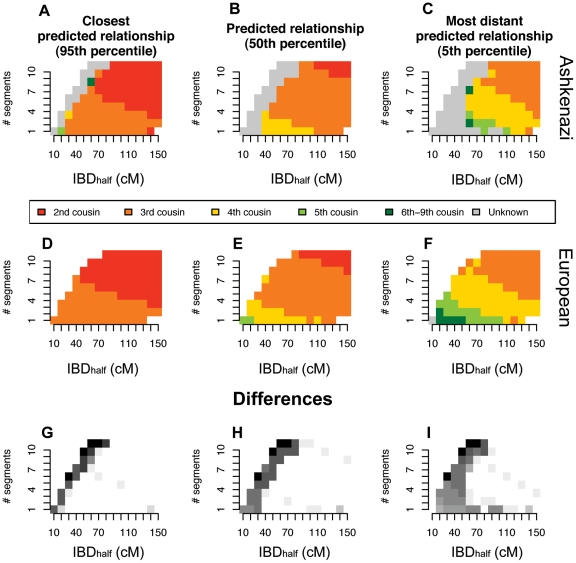
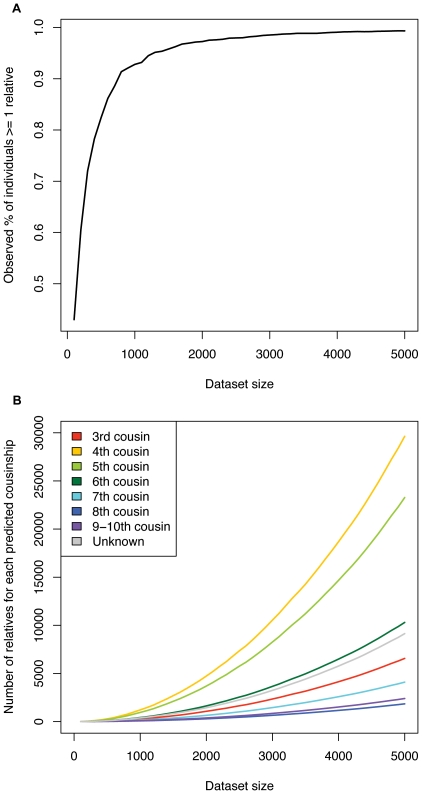
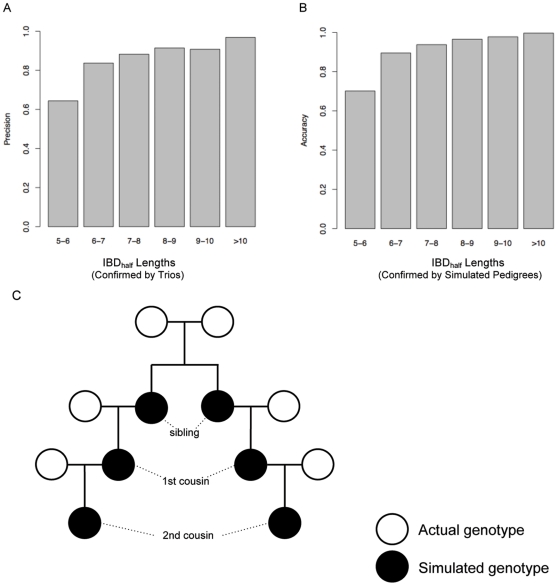
Although a few hundred single nucleotide polymorphisms (SNPs) suffice to infer close familial relationships, high density genome-wide SNP data make possible the inference of more distant relationships such as 2(nd) to 9(th) cousinships. In order to characterize the relationship between genetic similarity and degree of kinship given a timeframe of 100-300 years, we analyzed the sharing of DNA inferred to be identical by descent (IBD) in a subset of individuals from the 23andMe customer database (n = 22,757) and from the Human Genome Diversity Panel (HGDP-CEPH, n = 952). With data from 121 populations, we show that the average amount of DNA shared IBD in most ethnolinguistically-defined populations, for example Native American groups, Finns and Ashkenazi Jews, differs from continentally-defined populations by several orders of magnitude. Via extensive pedigree-based simulations, we determined bounds for predicted degrees of relationship given the amount of genomic IBD sharing in both endogamous and 'unrelated' population samples. Using these bounds as a guide, we detected tens of thousands of 2(nd) to 9(th) degree cousin pairs within a heterogenous set of 5,000 Europeans. The ubiquity of distant relatives, detected via IBD segments, in both ethnolinguistic populations and in large 'unrelated' populations samples has important implications for genetic genealogy, forensics and genotype/phenotype mapping studies.


Conflict of interest statement

Competing Interests: BMH, LH, JMM, NE, SS, and JLM are or were previously employed by 23andMe and own stock options in the company. The research described in this paper is related to a web site feature developed by 23andMe. This does not alter the authors' adherence to all the PLoS ONE policies on sharing data and materials. However, the authors' obligations to protect their customers' privacy (as outlined in our Terms of Service and Privacy Statement) prevent them from making their customers' individual-level data publicly available. Aggregate-level data (for example, in the form of tables that were used for the authors' statistics) can be made available upon request. This research was designed by the 23andMe, Inc. research team and funded by 23andMe, Inc. (www.23andme.com/research). There are no current external funding sources for this study. 23andMe, Inc. non-research staff had no role in the study design, data collection and analysis, decision to publish, or preparation of the manuscript.

Figures

Figure 1
Figure 1. Schematic of IBDhalf inference method.
IBDhalf segments were inferred from unphased genotype data where a series of alleles were identical by state for at least one of the homologous chromosomes in a given pair of individuals. IBD segments are indicated in purple. The boundaries of the IBD segments are defined by “opposite homozygotes”. Additionally, an IBD region had to be minimally 5 cM in length and contains >400 genotyped SNPs that were homozygous in at least one of the two individuals being compared (see Methods ).
Figure 2
Figure 2. Distributions of IBDhalf for pairs of individuals within three human populations.
The average amount of DNA that is identical by descent (mean IBDhalf) varies widely across HGDP-CEPH, European, Asian and Ashkenazi populations. We present distributions of pairwise comparisons with IBDhalf segments ≥7 cM for the (a) Karitiana Native Americans, (b) Yakut of Siberia, (c) Ashkenazi Jews primarily from the United States. Prior to the analysis, individuals were eliminated in order to remove close relationships (sibling, parent-child, avuncular, grandparent-grandchild, and 1st cousin pairs) (see Methods ). Pairs with less than 7 cM IBDhalf are not displayed. Distributions of IBDhalf for additional HGDP-CEPH samples are presented in Supplementary Material (Figure S1).
Figure 3
Figure 3. Relationship between degree of cousinship and IBDhalf metrics.
We used pedigree-based simulations to characterize the relationship between IBDhalf metrics and degrees of cousinship for multiple population samples. a) Genomic data from a European sample were used to simulate an 11-generation pedigree. The joint distribution of IBDhalf and number of IBDhalf segments is shown for each pairwise comparison from the pedigree simulations. GP/GC indicates grandparent/grandchild pairs. b) For each of eight populations, we summarize the distribution of IBDhalf by plotting IBDhalf(n) for the population by degree of cousinship. The degrees of cousinship distinguished by IBDhalf(n) asymptotes at different levels of IBD in ethnolinguistically-defined populations. Simulations were run on phased samples from several HGDP-CEPH population samples and European, Asian and Ashkenazi samples from a 23andMe customer dataset. Simulations were conducted by specifying an extended pedigree structure and simulating genomes for the pedigree by mating individuals drawn from a pool of empirical genomes (see Methods ).
Figure 4
Figure 4. Distributions of IBDhalf by degree of cousinship, assessed with simulated pedigrees for Ashkenazim and Europeans.
Plotted, for each combination of IBDhalf and number of IBD segments, are the 95th percentile, 50th percentile and 5th percentile degrees of cousinship based on 1 million simulated pedigrees. A–C) Ashkenazi pairs, D–F) European pairs, G–I) The differences between Ashkenazi and European results, presented in the prior panels, are represented in grey. Darker grey indicates higher number of differences. Each nth cousinship category was scaled by the expected number of nth degree cousins given a model of population growth (Table 2, Methods ). Simulations were conducted by specifying an extended pedigree and creating simulated genomes for the pedigree by mating individuals drawn from a pool of empirical genomes. Pairs of individuals who appear to share IBDhalf that was not inherited through the specified simulated pedigree are marked in grey in the A–F panels.
Figure 5
Figure 5. Fraction of 23andMe individuals with detectable distant relatives within subsamples inferred using IBDhalf.
A) The fraction of individuals with at least one predicted relative (2nd–9th cousin) given datasets of varying size. All datasets were drawn from a dataset of 5000 individuals with European ancestry. All closely related individuals (i.e., 1st or 2nd generation family) were removed before performing the analysis. B) The number of predicted cousins of each degree of cousinship given the dataset size. Predictions based on parameters obtained from simulations (Figure 4e).
Figure 6
Figure 6. Precision and accuracy of implemented IBD algorithm.
A) We considered how accurately we detect IBD segments that were transmitted between parent and child. We compared distant cousins with trios; we expect to observe sharing between a distant cousin and the child to also be observed in one of the parents for the same (or a longer) segment. Using this approach, we calculated the precision of our algorithm at different IBD segment lengths in a large sample of European-Americans. IBD segment lengths greater than 7 cM were observed 90% of the time in at least one parent. Preliminary data suggest that 7 cM segments shared between a distant cousin and child that were not observed in the parents were due to false negatives in the parents. B) We also examined our ability to detect IBD segments in simulated genotypes. After simulating large pedigrees, we examined 30,000 segments shorter than 200 cM resulting from 1st to 10th cousin relationships. We calculated the percentage of true IBD segments were detected by the IBDhalf algorithm at different cM lengths. IBD segment lengths greater than 7 cM were detected over 90% of the time. C) This schematic illustrates the pedigree simulations, where actual genotypes reflect individuals randomly sampled from a given population and simulated children with known degree relationships were tracked. The simulated genotypes were then analyzed using the IBD algorithm (see Methods for additional details).

References

    1. Gusev A, Lowe JK, Stoffel M, Daly MJ, Altshuler D, et al. Whole population, genome-wide mapping of hidden relatedness. Genom Res. 2009;19:318–326. - PMC - PubMed
    1. Scott L, Mohlke K, Bonnycastle L, Willer C, Li Y, et al. A genome-wide association study of type 2 diabetes in Finns detects multiple susceptibility variants. Science. 2007;316:1341–1345. - PMC - PubMed
    1. WTCCC. Genome-wide association study of 14,000 cases of seven common diseases and 3,000 shared controls. Nature. 2007;447:661–678. - PMC - PubMed
    1. Browning SR, Browning BL. High-resolution detection of identity by descent in unrelated individuals. Am J Hum Genet. 2010;86:526–539. - PMC - PubMed
    1. Huff CD, Witherspoon DJ, Simonson TS, Xing J, Watkins WS, et al. Maximum-likelihood estimation of recent shared ancestry (ERSA). Genom Res. 2011;21:768–774. - PMC - PubMed