. 2012;7(4):e34279.
doi: 10.1371/journal.pone.0034279. Epub 2012 Apr 11.

Genome-wide gene expression analysis in cancer cells reveals 3D growth to affect ECM and processes associated with cell adhesion but not DNA repair

Affiliations

Genome-wide gene expression analysis in cancer cells reveals 3D growth to affect ECM and processes associated with cell adhesion but not DNA repair

Oliver Zschenker et al. PLoS One. 2012.

Abstract

Cell morphology determines cell behavior, signal transduction, protein-protein interaction, and responsiveness to external stimuli. In cancer, these functions profoundly contribute to resistance mechanisms to radio- and chemotherapy. With regard to this aspect, this study compared the genome wide gene expression in exponentially growing cell lines from different tumor entities, lung carcinoma and squamous cell carcinoma, under more physiological three-dimensional (3D) versus monolayer cell culture conditions. Whole genome cDNA microarray analysis was accomplished using the Affymetrix HG U133 Plus 2.0 gene chip. Significance analysis of microarray (SAM) and t-test analysis revealed significant changes in gene expression profiles of 3D relative to 2D cell culture conditions. These changes affected the extracellular matrix and were mainly associated with biological processes like tissue development, cell adhesion, immune system and defense response in contrast to terms related to DNA repair, which lacked significant alterations. Selected genes were verified by semi-quantitative RT-PCR and Western blotting. Additionally, we show that 3D growth mediates a significant increase in tumor cell radio- and chemoresistance relative to 2D. Our findings show significant gene expression differences between 3D and 2D cell culture systems and indicate that cellular responsiveness to external stress such as ionizing radiation and chemotherapeutics is essentially influenced by differential expression of genes involved in the regulation of integrin signaling, cell shape and cell-cell contact.


Conflict of interest statement

Competing Interests: The authors have declared that no competing interests exist.

Figures

Figure 1
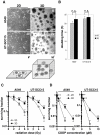
Figure 1. Cell morphology, doubling times and cellular radiosensitivity of A549 and UT-SCC15 cells under 2D or 3D growth conditions.
(A) Representative pictures and schematic of 2D (i, iii) and 3D (ii, iv) cell growth as found at day 4 immediately before RNA isolation. Bars, 50 µm. (B) Doubling times of 2D and 3D cell cultures at day 4 after plating. Results show mean ± SD (n = 3). n.s., not significant. Clonogenic survival of 2D or 3D grown cells exposed to increasing X-ray doses (2, 4 or 6 Gy) (C) or Cisplatin concentrations (0.1, 1, 5, 10 µM) (D) applied 24 h after plating. Cisplatin was removed after 24 h by 3- (2D) or 15-times (3D) washing with DMEM/10% FCS/1% NEAA. Results show mean ± SD (n = 3; t-test). * P<0.05; ** P<0.01. CDDP, Cisplatin. Bar, 200 µm.
Figure 2
Figure 2. Clusters and RNA ratios of differentially expressed genes in 3D and 2D cell cultures of A549 and UT-SCC15 cells.
(A) Hierarchical clusters of genes of 2D and 3D cell cultures at day 4 after plating. Red indicates genes expressed above average; green indicates genes expressed below average and black indicates average expression after Significance Analysis of Microarrays (SAM). “Positive” indicates genes upregulated in 3D versus 2D. “Negative” indicates genes downregulated in 3D versus 2D. (B) Plot of number of transcripts against signal log ratios from 3D versus 2D cell cultures of A549 and UT-SCC15 cells. (C) Gene Ontology-dependent plotting of absolute numbers and percentage of significantly modified genes in 3D versus 2D cell cultures according to SAM analysis.
Figure 3
Figure 3. Signal log ratios of selected genes from DNA microarray-based analysis subjected to semi-quantitative RT-PCR verification.
Expression of the genes TXNIP1, DUSP6, CEACAM1, NPC1 and BCL2A1 is delineated comparatively from 3D versus 2D cell cultures of A549 and UT-SCC15 cells.
Figure 4
Figure 4. Validation of microarray gene expression data by semi-quantitative RT-PCR.
(A) Semi-quantitative RT-PCR was performed as described under Materials and Methods. Shown are 1% agarose gels with RT-PCR fragments of TXNIP, DUSP6, CEACAM1, NPC1 and BCL2A1 mRNAs isolated from A549 or UT-SCC15 cells. Samples were amplified from cDNA generated by reverse transcription of total RNA of 4-day old 3D and 2D cell cultures. All experiments (V1, V2, V3) are exhibited. β-actin expression served as loading control (540 bp). (B) Graphs display results from densitometric analysis of indicated mRNA expression after normalization to β-actin. Results show mean ± SD (n = 3).
Figure 5
Figure 5. Validation of microarray gene expression data on protein level.
(A) Signal log ratios of selected genes (FN1, CTGF, ERBB3 and BCL2A1) from DNA microarray-based analysis subjected to Western blot analysis. (B) Whole cell lysates were prepared from 3D and 2D cell cultures on day 4 after plating. SDS-PAGE and Western blot analysis were performed as described under Material and Methods. Representative images show expression of Fibronectin (240 kDa), CTGF (38 kDa), ErbB3 (180 kDa) and BCL2A1 (20 kDa). β-actin served as loading control. (C) Densitometric units of protein bands shown in ‘B’ are plotted upon normalization to β-actin.

References

    1. Nelson CM, Inman JL, Bissell MJ. Three-dimensional lithographically defined organotypic tissue arrays for quantitative analysis of morphogenesis and neoplastic progression. Nat Protoc. 2008;3:674–678. - PMC - PubMed
    1. Spencer VA, Xu R, Bissell MJ. Extracellular matrix, nuclear and chromatin structure, and gene expression in normal tissues and malignant tumors: a work in progress. Adv Cancer Res. 2007;97:275–294. - PMC - PubMed
    1. Barcellos-Hoff MH, Aggeler J, Ram TG, Bissell MJ. Functional differentiation and alveolar morphogenesis of primary mammary cultures on reconstituted basement membrane. Development. 1989;105:223–235. - PMC - PubMed
    1. Smalley KS, Lioni M, Herlyn M. Life isn't flat: taking cancer biology to the next dimension. In Vitro Cell Dev Biol Anim. 2006;42:242–247. - PubMed
    1. Fournier MV, Martin KJ, Kenny PA, Xhaja K, Bosch I, et al. Gene expression signature in organized and growth-arrested mammary acini predicts good outcome in breast cancer. Cancer Res. 2006;66:7095–7102. - PMC - PubMed

Publication types

MeSH terms