. 2012;7(4):e34578.
doi: 10.1371/journal.pone.0034578. Epub 2012 Apr 3.

The glass is half-full: overestimating the quality of a novel environment is advantageous

Affiliations

The glass is half-full: overestimating the quality of a novel environment is advantageous

Oded Berger-Tal et al. PLoS One. 2012.

Abstract

According to optimal foraging theory, foraging decisions are based on the forager's current estimate of the quality of its environment. However, in a novel environment, a forager does not possess information regarding the quality of the environment, and may make a decision based on a biased estimate. We show, using a simple simulation model, that when facing uncertainty in heterogeneous environments it is better to overestimate the quality of the environment (to be an "optimist") than underestimate it, as optimistic animals learn the true value of the environment faster due to higher exploration rate. Moreover, we show that when the animal has the capacity to remember the location and quality of resource patches, having a positively biased estimate of the environment leads to higher fitness gains than having an unbiased estimate, due to the benefits of exploration. Our study demonstrates how a simple model of foraging with incomplete information, derived directly from optimal foraging theory, can produce well documented complex space-use patterns of exploring animals.


Conflict of interest statement

Competing Interests: The authors have declared that no competing interests exist.

Figures

Figure 1
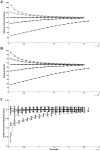
Figure 1. The estimate of the environment, giving-up density, and intake rate (panels a-c respectively) as a function of time, for foragers with learning capabilities but no spatial memory.
The lines' color and shape represent different foragers making decisions according to different estimates of the environment quality. The black solid line represents foragers making their decision according to an estimate of 100 food units, which is equal to the true mean value of the environment quality. The dashed black line represents mild pessimists making their decisions according to an estimate of 75 food units - a 25% negative bias. The dashed-dotted black line represents extreme pessimists with an estimate of 25 food units – a 75% negative bias. The dashed and dashed-dotted gray lines represent mild and extreme optimists with a 25% and 75% positive bias respectively (i.e., estimates of 125 and 175 food units). In all cases the lines represent the average of 100 simulation runs, each terminated after the consumption of 10,000 food units. Error bars represent one standard deviation.
Figure 2
Figure 2. The average life-time intake rate (the intake rate average over the whole period of the simulation) as a function of the initial estimate of the environment quality for foragers with memory but without learning capabilities.
The solid line represents a forager with a long time-frame of foraging (i.e., a simulation which ended after the forager consumed 10,000 food units). The dashed line represents a forager with an intermediate time-frame (1,000 food units), and the dotted line represents a forager with a short time-frame (100 food units). The dotted vertical line indicates on the average quality of the environment. Error bars represent one standard deviation.
Figure 3
Figure 3. The exploration rate, average range quality, and range size (panels a–c respectively) as a function of time, for foragers with spatial memory but without learning capabilities.
The different lines represent foragers with different initial estimates of the environment, as detailed in the caption for figure 1. Error bars represent one standard deviation.
Figure 4
Figure 4. The average life-time intake rate (the intake rate average over the whole period of the simulation) as a function of the initial estimate of the environment quality for foragers with both spatial memory and learning capabilities.
The solid line represents a forager with a long time-frame of foraging (i.e., a simulation which ended after the forager consumed 10,000 food units). The dashed line represents a forager with an intermediate time-frame (1,000 food units), and the dotted line represents a forager with a short time-frame (100 food units). The dotted vertical line indicates on the average quality of the environment. Error bars represent one standard deviation.
Figure 5
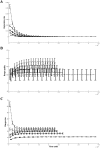
Figure 5. The exploration rate, average range quality; and range size (panels a–c respectively) as a function of time, for foragers with both spatial memory and learning capabilities.
The different lines represent foragers with different initial estimates of the environment, as detailed in the caption for figure 1. Error bars represent one standard deviation.

References

    1. Egas M, Sabelis MW. Adaptive learning of host preference in a herbivorous arthropod. Ecol Lett. 2001;4:190–195.
    1. Radespiel U, Zimmermann E. The influence of familiarity, age, experience and female mate choice on pregnancies in captive grey mouse lemurs. Behaviour. 2003;140:301–318.
    1. Rutz C, Whittingham MJ, Newton I. Age-dependent diet choice in an avian top predator. Proc R Soc Lond B Biol Sci. 2006;273:579–586. - PMC - PubMed
    1. Dukas R. Life history of learning: performance curves of honeybees in the wild. Ethology. 2008;114:1195–1200.
    1. Metzgar LH. An experimental comparison of screech owl predation on resident and transient white-footed mice (Peromyscus leucopus). J Mammal. 1967;48:387–391.

Publication types