

Glucose and fatty acid metabolism in a 3 tissue in-vitro model challenged with normo- and hyperglycaemia
- PMID: 22509346
- PMCID: PMC3324505
- DOI: 10.1371/journal.pone.0034704
Glucose and fatty acid metabolism in a 3 tissue in-vitro model challenged with normo- and hyperglycaemia
Abstract
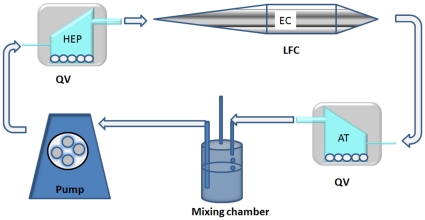
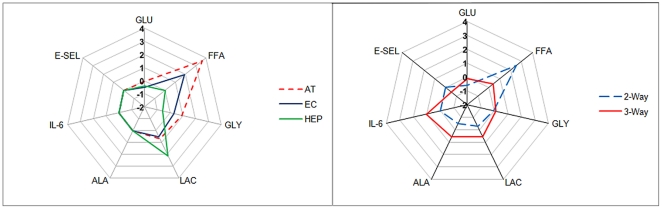
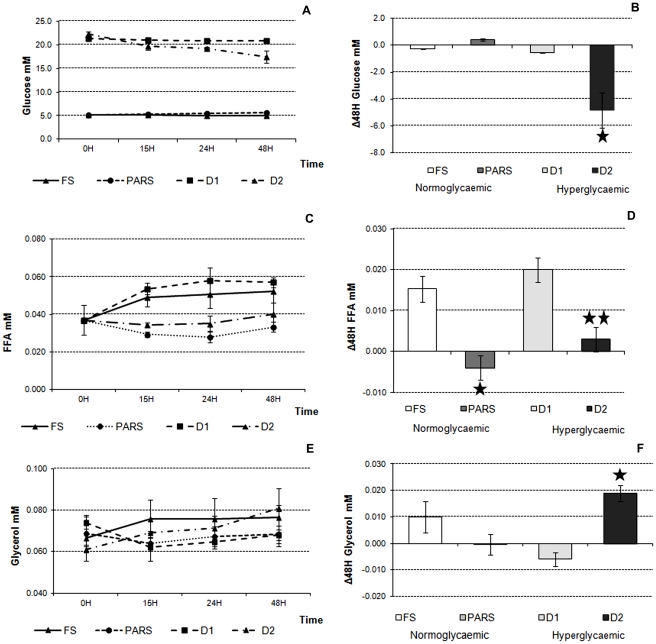
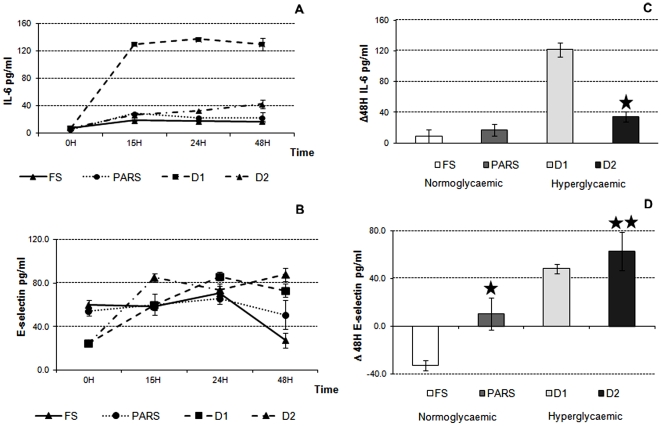
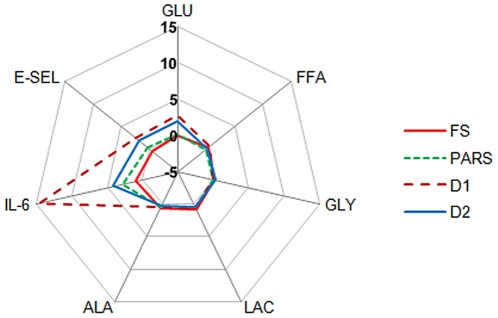
Nutrient balance in the human body is maintained through systemic signaling between different cells and tissues. Breaking down this circuitry to its most basic elements and reconstructing the metabolic network in-vitro provides a systematic method to gain a better understanding of how cross-talk between the organs contributes to the whole body metabolic profile and of the specific role of each different cell type. To this end, a 3-way connected culture of hepatocytes, adipose tissue and endothelial cells representing a simplified model of energetic substrate metabolism in the visceral region was developed. The 3-way culture was shown to maintain glucose and fatty acid homeostasis in-vitro. Subsequently it was challenged with insulin and high glucose concentrations to simulate hyperglycaemia. The aim was to study the capacity of the 3-way culture to maintain or restore normal circulating glucose concentrations in response to insulin and to investigate the effects these conditions on other metabolites involved in glucose and lipid metabolism. The results show that the system's metabolic profile changes dramatically in the presence of high concentrations of glucose, and that these changes are modulated by the presence of insulin. Furthermore, we observed an increase in E-selectin levels in hyperglycaemic conditions and increased IL-6 concentrations in insulin-free-hyperglycaemic conditions, indicating, respectively, endothelial injury and proinflammatory stress in the challenged 3-way system.
Conflict of interest statement
Figures

Similar articles
-
An in vitro model of glucose and lipid metabolism in a multicompartmental bioreactor.Biotechnol J. 2012 Jan;7(1):117-26. doi: 10.1002/biot.201100177. Epub 2011 Oct 7. Biotechnol J. 2012. PMID: 21805642
-
Lipid metabolism in human skeletal muscle cells: effects of palmitate and chronic hyperglycaemia.Acta Physiol Scand. 2005 Jan;183(1):31-41. doi: 10.1111/j.1365-201X.2004.01381.x. Acta Physiol Scand. 2005. PMID: 15654918 Review.
-
The actions of dichloroacetic acid on blood glucose, liver glycogen and fatty acid synthesis in obese-hyperglycaemic (ob/ob) and lean mice.Horm Metab Res. 1983 May;15(5):225-9. doi: 10.1055/s-2007-1018678. Horm Metab Res. 1983. PMID: 6347856
-
Cooperation of liver cells in health and disease.Adv Anat Embryol Cell Biol. 2001;161:III-XIII, 1-151. doi: 10.1007/978-3-642-56553-3. Adv Anat Embryol Cell Biol. 2001. PMID: 11729749 Review.
-
Lipid and glucose metabolism in hepatocyte cell lines and primary mouse hepatocytes: a comprehensive resource for in vitro studies of hepatic metabolism.Am J Physiol Endocrinol Metab. 2019 Apr 1;316(4):E578-E589. doi: 10.1152/ajpendo.00365.2018. Epub 2019 Jan 29. Am J Physiol Endocrinol Metab. 2019. PMID: 30694691
Cited by
-
Microfabricated mammalian organ systems and their integration into models of whole animals and humans.Lab Chip. 2013 Apr 7;13(7):1201-12. doi: 10.1039/c3lc41017j. Lab Chip. 2013. PMID: 23388858 Free PMC article. Review.
-
Evolution of Biochip Technology: A Review from Lab-on-a-Chip to Organ-on-a-Chip.Micromachines (Basel). 2020 Jun 18;11(6):599. doi: 10.3390/mi11060599. Micromachines (Basel). 2020. PMID: 32570945 Free PMC article. Review.
-
Multi-Organ toxicity demonstration in a functional human in vitro system composed of four organs.Sci Rep. 2016 Feb 3;6:20030. doi: 10.1038/srep20030. Sci Rep. 2016. PMID: 26837601 Free PMC article.
-
Emerging In Vitro Liver Technologies for Drug Metabolism and Inter-Organ Interactions.Tissue Eng Part B Rev. 2016 Oct;22(5):383-394. doi: 10.1089/ten.TEB.2016.0031. Epub 2016 Jun 1. Tissue Eng Part B Rev. 2016. PMID: 27049038 Free PMC article. Review.
-
Supplementation with the extract of schisandrae fructus pulp, seed, or their combination influences the metabolism of lipids and glucose in mice fed with normal and hypercholesterolemic diet.Evid Based Complement Alternat Med. 2014;2014:472638. doi: 10.1155/2014/472638. Epub 2014 Apr 30. Evid Based Complement Alternat Med. 2014. PMID: 24876871 Free PMC article.
References
-
- Avogaro A, Crepaldi C, Miola M, Maran A, Pengo V, et al. High blood ketone body concentration in type 2 non-insulin dependent diabetic patients. Journal of endocrinological investigation. 1996;19:99–105. - PubMed
-
- Grundy SM, Barnett JP. Metabolic and health complications of obesity. Disease-a-month: DM. 1990;36:641–731. - PubMed
-
- Abu-Lebdeh HS, Nair KS. Protein metabolism in diabetes mellitus. Baillière’s clinical endocrinology and metabolism. 1996;10:589–601. - PubMed
-
- Newgard CB, An J, Bain JR, Muehlbauer MJ, Stevens RD, et al. A branched-chain amino acid-related metabolic signature that differentiates obese and lean humans and contributes to insulin resistance. Cell metabolism. 2009;9:311–326. doi: 10.1016/j.cmet.2009.02.002. - DOI - PMC - PubMed
-
- Avogaro A, Toffolo G, Miola M, Valerio A, Tiengo A, et al. Intracellular lactate- and pyruvate-interconversion rates are increased in muscle tissue of non-insulin-dependent diabetic individuals. The Journal of clinical investigation. 1996;98:108–115. doi: 10.1172/JCI118754. - DOI - PMC - PubMed
MeSH terms
Substances
LinkOut - more resources
Full Text Sources
Medical
