. 2012;7(4):e35157.
doi: 10.1371/journal.pone.0035157. Epub 2012 Apr 11.

Protein signature of lung cancer tissues

Affiliations

Protein signature of lung cancer tissues

Michael R Mehan et al. PLoS One. 2012.

Abstract

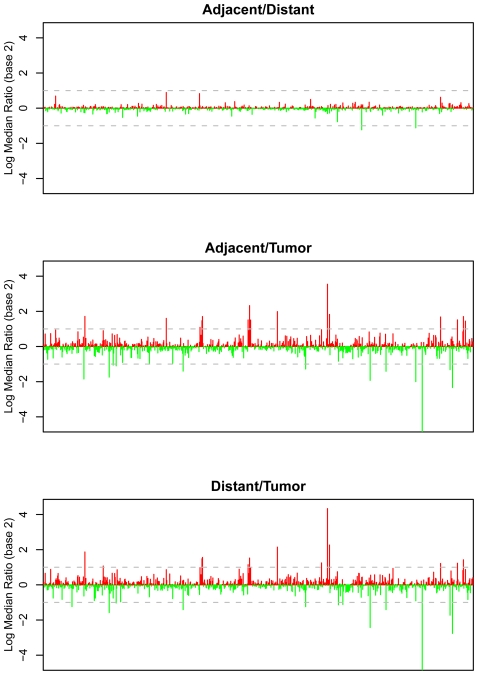
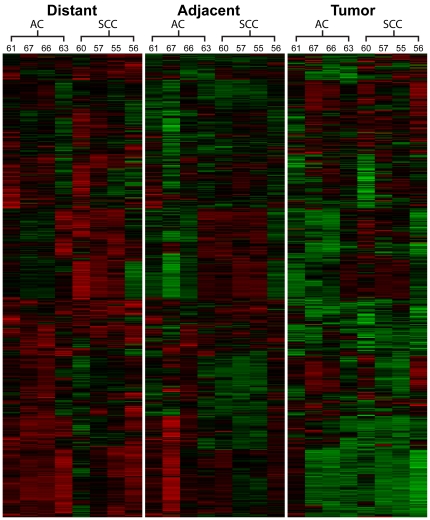
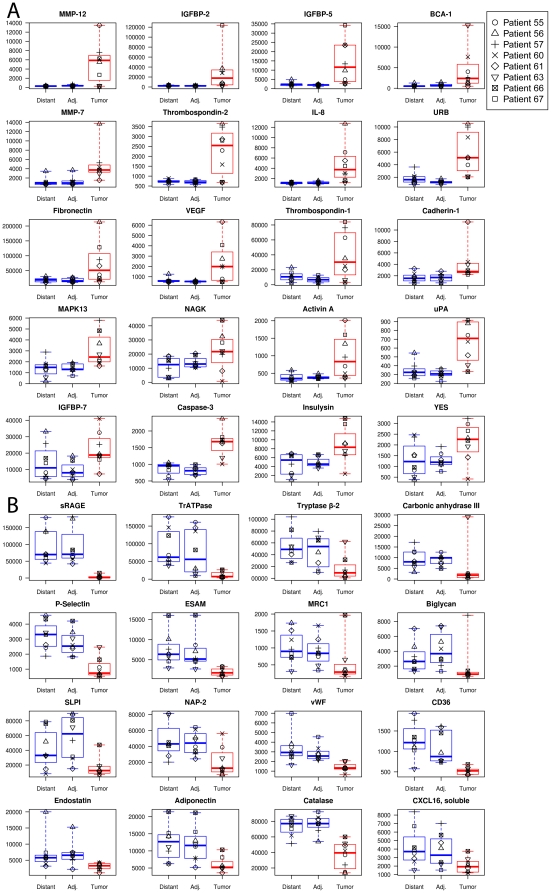
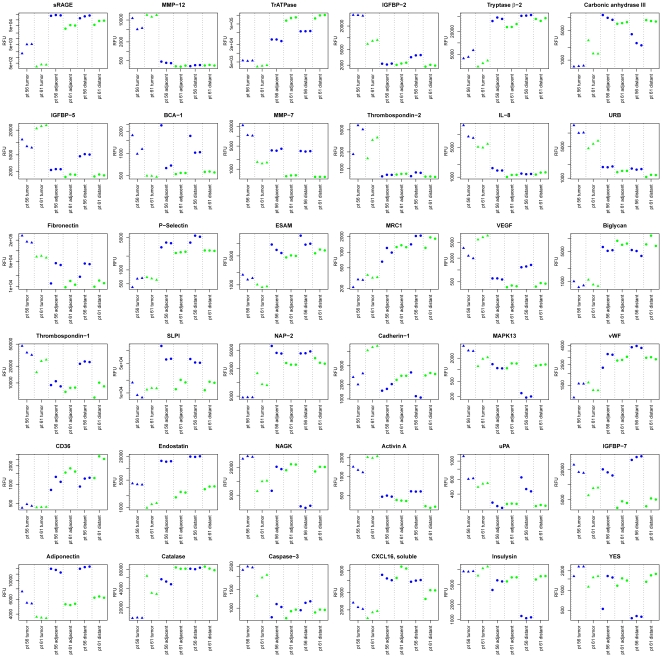
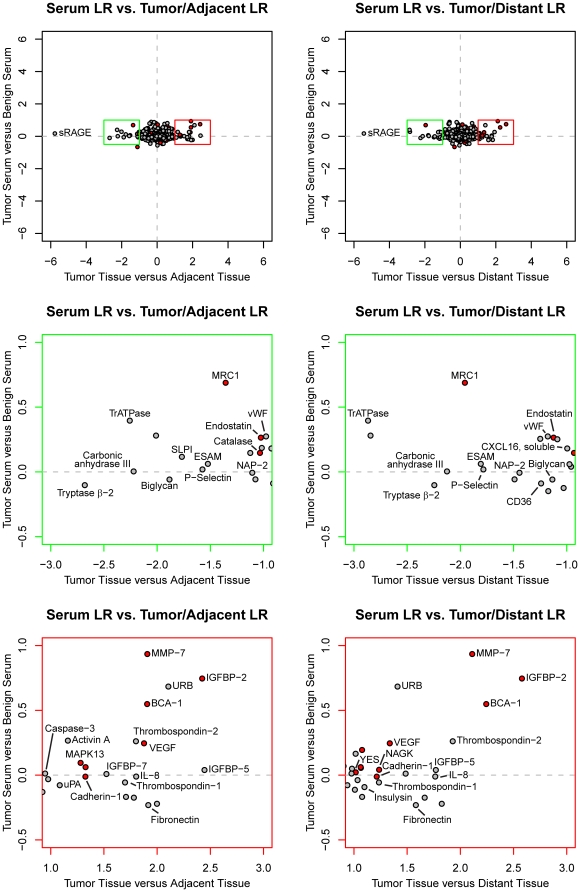
Lung cancer remains the most common cause of cancer-related mortality. We applied a highly multiplexed proteomic technology (SOMAscan) to compare protein expression signatures of non small-cell lung cancer (NSCLC) tissues with healthy adjacent and distant tissues from surgical resections. In this first report of SOMAscan applied to tissues, we highlight 36 proteins that exhibit the largest expression differences between matched tumor and non-tumor tissues. The concentrations of twenty proteins increased and sixteen decreased in tumor tissue, thirteen of which are novel for NSCLC. NSCLC tissue biomarkers identified here overlap with a core set identified in a large serum-based NSCLC study with SOMAscan. We show that large-scale comparative analysis of protein expression can be used to develop novel histochemical probes. As expected, relative differences in protein expression are greater in tissues than in serum. The combined results from tissue and serum present the most extensive view to date of the complex changes in NSCLC protein expression and provide important implications for diagnosis and treatment.


Conflict of interest statement

Competing Interests: The authors have read the journal's policy and have the following conflicts: M Mehan, D Ayers, D Zichi, R Ostroff, E Brody, J Walker, L Gold, T Jarvis, N Janjic, and S Wilcox are full-time employees of SomaLogic. D Thirstrup and G Baird have received research funding from SomaLogic. These interests do not alter the authors' adherence to the PLoS ONE policies on sharing data and materials.

Figures

Figure 1
Figure 1. Relative changes in protein expression for 820 proteins from eight NSCLC resection samples.
Signal differences between adjacent and distant tissue (panel A), tumor and adjacent tissue (panel B) and tumor and distant tissue (panel C) are expressed as log2 median ratios. The dotted line represents two-fold change (log2 = 1).
Figure 2
Figure 2. Heat map of protein levels in tumor tissue samples.
The samples are displayed in columns and separated into distant non-tumor, adjacent non-tumor, and tumor tissue. Within each tissue type, the samples are separated into adenocarcinomas (AC) or squamous cell carcinomas (SCC). The numbers above each column correspond to patient codes. The proteins are displayed in rows and were ordered using hierarchical clustering.
Figure 3
Figure 3. Box plots of SOMAmer signals in the tissue homogenates.
Proteins with increased (panel A) or decreased (panel B) levels in tumor tissue compared with adjacent or distal tissue (panel A) from eight NSCLC samples used in this study. Each individual is indicated with a different symbol. The horizontal lines of each box correspond to the first, second, and third quartiles (25%/50%/75%) and the whiskers correspond to the maximum and minimum values.
Figure 4
Figure 4. Plot of the cumulative density function (CDF) for the coefficient of variation (CV) between triplicate samples.
The tumor, adjacent non-tumor, and distant non-tumor tissue resections were sampled, extracted, and analyzed with the SOMAscan proteomic assay in triplicate for two individuals in the study. The median CV for all 6 triplicates was 4.5% (black line).
Figure 5
Figure 5. Plots of triplicate samples for the 36 analytes with the largest mean fold-change in protein expression between tumor and non-tumor tissue samples (Table 2).
The tumor, adjacent non-tumor, and distant non-tumor tissue resections were sampled, extracted, and analyzed with the SOMAscan proteomics assay in triplicate for two individuals (patients 56 and 61) in the study. The samples are colored by individual and the tumor samples are highlighted as triangles. The y-axis is on a log scale.
Figure 6
Figure 6. SOMAmer histochemistry on frozen tissue sections for selected biomarkers detected in this study.
(A) Thrombospondin-2 SOMAmer (red) staining the fibrocollagenous matrix surrounding a tumor nest. (B) Corresponding normal lung specimen stained with Thrombospondin-2 SOMAmer (red). (C) Macrophage mannose receptor SOMAmer (red) staining scattered macrophages in a lung adenocarcinoma. (D) Macrophage Mannose Receptor SOMAmer (red) staining numerous alveolar macrophages in a section of normal lung parenchyma. (E) Multicolor image highlighting the cytomorphologic distribution of macrophage mannose receptor SOMAmer staining: Green = Cytokeratin (AE1/AE3 antibody), Red = CD31 (EP3095 Antibody), and Orange = SOMAmer. All nuclei in this figure are counterstained with DAPI.
Figure 7
Figure 7. Thrombospondin-2 (TSP-2) histochemical identification in tissue samples.
TSP-2 is identified in serial frozen sections of a single lung carcinoma specimen by (A) a home-made rabbit polyclonal TSP-2 polyclonal antibody, (B) the pre-immune serum from rabbits used to make the home-made polyclonal antibody, (C) a commercial (Novus) rabbit polyclonal TSP-2 antibody, and (D) the TSP-2 SOMAmer. The TSP-2 SOMAmer was used to stain frozen sections of normal and malignant lung tissue, with standard Avidin-Biotin-Peroxidase color development, to demonstrate different morphologic distributions: (E) Strong staining of the fibrotic stroma surrounding tumor nests, with minimal cytosolic staining of carcinoma cells, (F) Strong staining of the fibrotic stroma surrounding tumor nests in a mucinous adenocarcinoma, with no significant staining of the carcinoma cells, (G) normal lung tissue, showing strong cytosolic staining of bronchial epithelium and scattered alveolar macrophages, and (H) strong cytosolic staining of an adenocarcinoma, with no significant staining of the non-fibrotic, predominantly inflammatory stroma.
Figure 8
Figure 8. ESAM histochemical staining in tissue samples.
ESAM staining is shown in lung tumor (A,C) and normal lung (B,D) distant from the tumor. Endothelial cells are visibly more abundant in the normal lung section, consistent with the high vascularity of normal lung. Raw images are shown in A and C, with ESAM-positive cells identified by the CellProfiler algorithm marked with a “1” in images B and D.
Figure 9
Figure 9. Changes in protein expression in NSCLC tissue compared to serum.
The top two panels show the log2 ratio (LR) derived from serum samples versus log ratios derived from adjacent tissue and distant tissue, respectively. The bottom four panels feature zoomed portions of plots above, indicated by the color of the plot (green for decreased and red for increased expression compared to non-tumor tissue). Analytes shown in Figure 2 have been labeled and analytes mentioned in the publication on the serum samples are shown in filled red symbols red.

References

    1. Okada M, Nishio W, Sakamoto T, Uchino K, Yuki T, et al. Effect of tumor size on prognosis in patients with non-small cell lung cancer: the role of segmentectomy as a type of lesser resection. J Thorac Cardiovasc Surg. 2005;129:87–93. - PubMed
    1. Kassis ES, Vaporciyan AA, Swisher SG, Correa AM, Bekele BN, et al. Application of the revised lung cancer staging system (IASLC Staging Project) to a cancer center population. J Thorac Cardiovasc Surg. 2009;138:412–418. - PMC - PubMed
    1. Jemal A, Siegel R, Ward E, Hao Y, Xu J, et al. Cancer statistics, 2008. CA - Cancer J Clin. 2008;58:71–96. - PubMed
    1. Boyle P, Levin B, editors. World Cancer Report. Lyon: International Agency for Research on Cancer (IARC); 2008.
    1. Gold L, Ayers D, Bertino J, Bock C, Bock A, et al. Aptamer-based multiplexed proteomic technology for biomarker discovery. PLoS One. 2010;5:e15004. - PMC - PubMed

MeSH terms